406 lines
18 KiB
Plaintext
406 lines
18 KiB
Plaintext
import { Card, Prerequisites, Details, WorkflowDiagram } from "docs-ui"
|
|
import { Github, PlaySolid } from "@medusajs/icons"
|
|
|
|
export const metadata = {
|
|
title: `Integrate Sentry (Instrumentation) with Medusa`,
|
|
}
|
|
|
|
# {metadata.title}
|
|
|
|
In this tutorial, you'll learn how to integrate Sentry with your Medusa application to monitor performance and track errors effectively.
|
|
|
|
When you install a Medusa application, you get a fully-fledged commerce platform with a Framework for customization. An essential part of building customizations is tracking errors in them and ensuring they have good performance.
|
|
|
|
Medusa facilitates error tracking and performance monitoring by integrating with instrumentation tools like [Sentry](https://sentry.io/). Sentry provides real-time tracking of errors and performance issues in your application, allowing you to identify and fix them quickly.
|
|
|
|
In this tutorial, you'll integrate Sentry with Medusa to monitor your application's performance and errors.
|
|
|
|
## Summary
|
|
|
|
By following this tutorial, you'll learn how to:
|
|
|
|
- Install and set up Medusa.
|
|
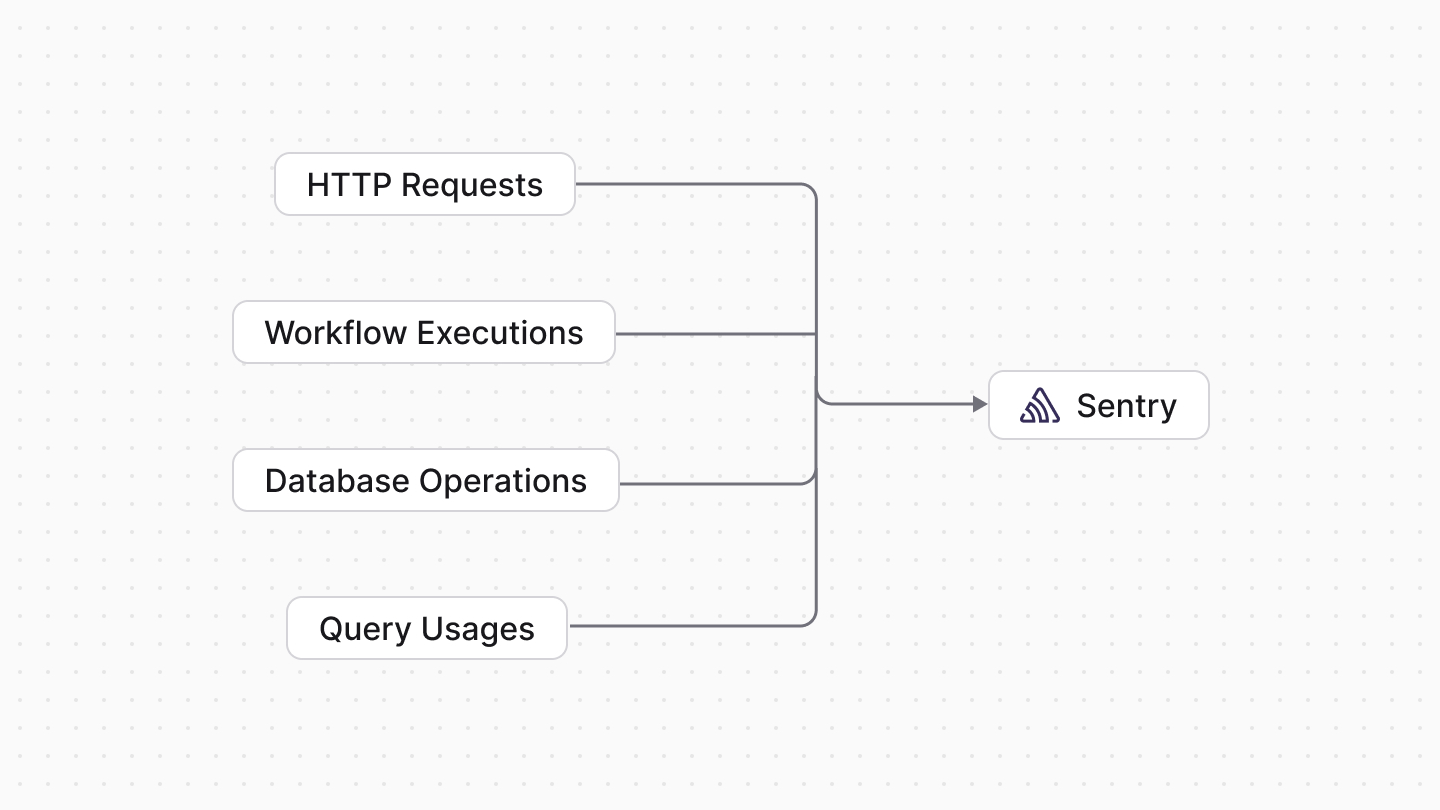
- Set up instrumentation with Sentry. You'll trace HTTP requests, workflows, Query usages, and database operations.
|
|
- Capture HTTP request errors in Sentry.
|
|
- Test monitoring and error tracking.
|
|
|
|
You can follow this tutorial whether you're new to Medusa or an advanced Medusa developer.
|
|
|
|
|
|
|
|
<Card
|
|
title="Example Repository"
|
|
text="Find the full code of the guide in this repository."
|
|
href="https://github.com/medusajs/examples/tree/main/sentry-integration"
|
|
icon={Github}
|
|
/>
|
|
|
|
---
|
|
|
|
## Step 1: Install a Medusa Application
|
|
|
|
<Prerequisites items={[
|
|
{
|
|
text: "Node.js v20+",
|
|
link: "https://nodejs.org/en/download"
|
|
},
|
|
{
|
|
text: "Git CLI tool",
|
|
link: "https://git-scm.com/downloads"
|
|
},
|
|
{
|
|
text: "PostgreSQL",
|
|
link: "https://www.postgresql.org/download/"
|
|
}
|
|
]} />
|
|
|
|
Start by installing the Medusa application on your machine with the following command:
|
|
|
|
```bash
|
|
npx create-medusa-app@latest
|
|
```
|
|
|
|
First, you'll be asked for the project's name. Then, when prompted about installing the [Next.js Starter Storefront](../../../nextjs-starter/page.mdx), choose "Yes."
|
|
|
|
Afterwards, the installation process will start, which will install the Medusa application in a directory with your project's name and the Next.js Starter Storefront in a separate directory named `{project-name}-storefront`.
|
|
|
|
<Note title="Why is the storefront installed separately?">
|
|
|
|
The Medusa application is composed of a headless Node.js server and an admin dashboard. The storefront is installed or custom-built separately and connects to the Medusa application through its REST endpoints, called [API routes](!docs!/learn/fundamentals/api-routes). Learn more in [Medusa's Architecture documentation](!docs!/learn/introduction/architecture).
|
|
|
|
</Note>
|
|
|
|
Once the installation finishes successfully, the Medusa Admin dashboard will open with a form to create a new user. Enter the user's credentials and submit the form. Afterwards, you can log in with the new user and explore the dashboard.
|
|
|
|
<Note title="Ran into Errors?">
|
|
|
|
Check out the [troubleshooting guides](../../../troubleshooting/create-medusa-app-errors/page.mdx) for help.
|
|
|
|
</Note>
|
|
|
|
---
|
|
|
|
## Step 2: Set Up Instrumentation with Sentry
|
|
|
|
Medusa supports instrumentation and reporting through OpenTelemetry, which allows you to integrate with various monitoring tools, including Sentry. This also gives you the flexibility to switch between different monitoring tools without changing your codebase.
|
|
|
|
In this step, you'll set up instrumentation in your Medusa application using Sentry.
|
|
|
|
<Note>
|
|
|
|
Refer to the [Instrumentation](!docs!/learn/debugging-and-testing/instrumentation) documentation for more details on how to set up instrumentation in Medusa.
|
|
|
|
</Note>
|
|
|
|
### a. Install Instrumentation Dependencies
|
|
|
|
To set up instrumentation in Medusa, you need to install the necessary OpenTelemetry dependencies.
|
|
|
|
In your Medusa application's directory, run the following command:
|
|
|
|
```bash npm2yarn
|
|
npm install @opentelemetry/sdk-node @opentelemetry/resources @opentelemetry/sdk-trace-node @opentelemetry/instrumentation-pg
|
|
```
|
|
|
|
Then, you need to install the dependencies necessary for the monitoring tool you want to use, which is Sentry in this case.
|
|
|
|
So, run the following command to install the necessary Sentry dependencies:
|
|
|
|
```bash npm2yarn
|
|
npm install @sentry/node @opentelemetry/api @opentelemetry/exporter-trace-otlp-grpc @sentry/opentelemetry-node
|
|
```
|
|
|
|
### b. Configure Instrumentation
|
|
|
|
Now that you have the necessary dependencies installed, you need to configure instrumentation in your Medusa application.
|
|
|
|
You can configure instrumentation in a special `instrumentation.ts` file at the root of your Medusa application. The Medusa application automatically loads this file when it starts.
|
|
|
|
You should already have a file named `instrumentation.ts` in your Medusa application with commented-out code. Replace the file's content with the following:
|
|
|
|
```ts title="instrumentation.ts"
|
|
import Sentry from "@sentry/node"
|
|
import otelApi from "@opentelemetry/api"
|
|
import { registerOtel } from "@medusajs/medusa"
|
|
import { OTLPTraceExporter } from "@opentelemetry/exporter-trace-otlp-grpc"
|
|
import {
|
|
SentrySpanProcessor,
|
|
SentryPropagator,
|
|
} from "@sentry/opentelemetry-node"
|
|
|
|
Sentry.init({
|
|
dsn: process.env.SENTRY_DSN,
|
|
tracesSampleRate: 1.0,
|
|
// @ts-ignore
|
|
instrumenter: "otel",
|
|
})
|
|
|
|
otelApi.propagation.setGlobalPropagator(new SentryPropagator())
|
|
|
|
export function register() {
|
|
registerOtel({
|
|
serviceName: "medusa",
|
|
spanProcessors: [new SentrySpanProcessor()],
|
|
traceExporter: new OTLPTraceExporter(),
|
|
instrument: {
|
|
http: true,
|
|
workflows: true,
|
|
query: true,
|
|
db: true,
|
|
},
|
|
})
|
|
}
|
|
```
|
|
|
|
You first initialize Sentry with your Data Source Name (DSN), which you'll retrieve and set as an environment variable soon. You also set the `tracesSampleRate` to `1.0`, which enables tracing in your Sentry project.
|
|
|
|
Next, you set the global propagator to Sentry's propagator, which allows Sentry to propagate trace context across your application.
|
|
|
|
Finally, you export a `register` function that registers OpenTelemetry. It uses the `registerOtel` function from Medusa, which accepts [OpenTelemetry configurations](https://open-telemetry.github.io/opentelemetry-js/interfaces/_opentelemetry_sdk-node.NodeSDKConfiguration.html) with the following custom Medusa options:
|
|
|
|
- `serviceName`: The name of your service, which you set to "medusa". You can change it to a more descriptive name if needed.
|
|
- `instrument`: An object that specifies what to trace in your Medusa application. You enable tracing for HTTP requests, workflows, Query usages, and database operations by setting their respective properties to `true`.
|
|
|
|
You can add any additional configurations to either Sentry or OpenTelemetry as needed for your use case.
|
|
|
|
### c. Set Up a Sentry Project
|
|
|
|
The final piece to get the Sentry integration working is to set up a Sentry project and get your DSN. The DSN is a unique identifier for your Sentry project that allows your Medusa application to send error and performance data to Sentry.
|
|
|
|
To set up a Sentry project:
|
|
|
|
1. [Log in or sign up](https://sentry.io/signup/) to Sentry.
|
|
2. In your Sentry dashboard, if you're new to Sentry, click the "Start" button. Otherwise, go to Projects from the sidebar and click the "Create Project" button.
|
|
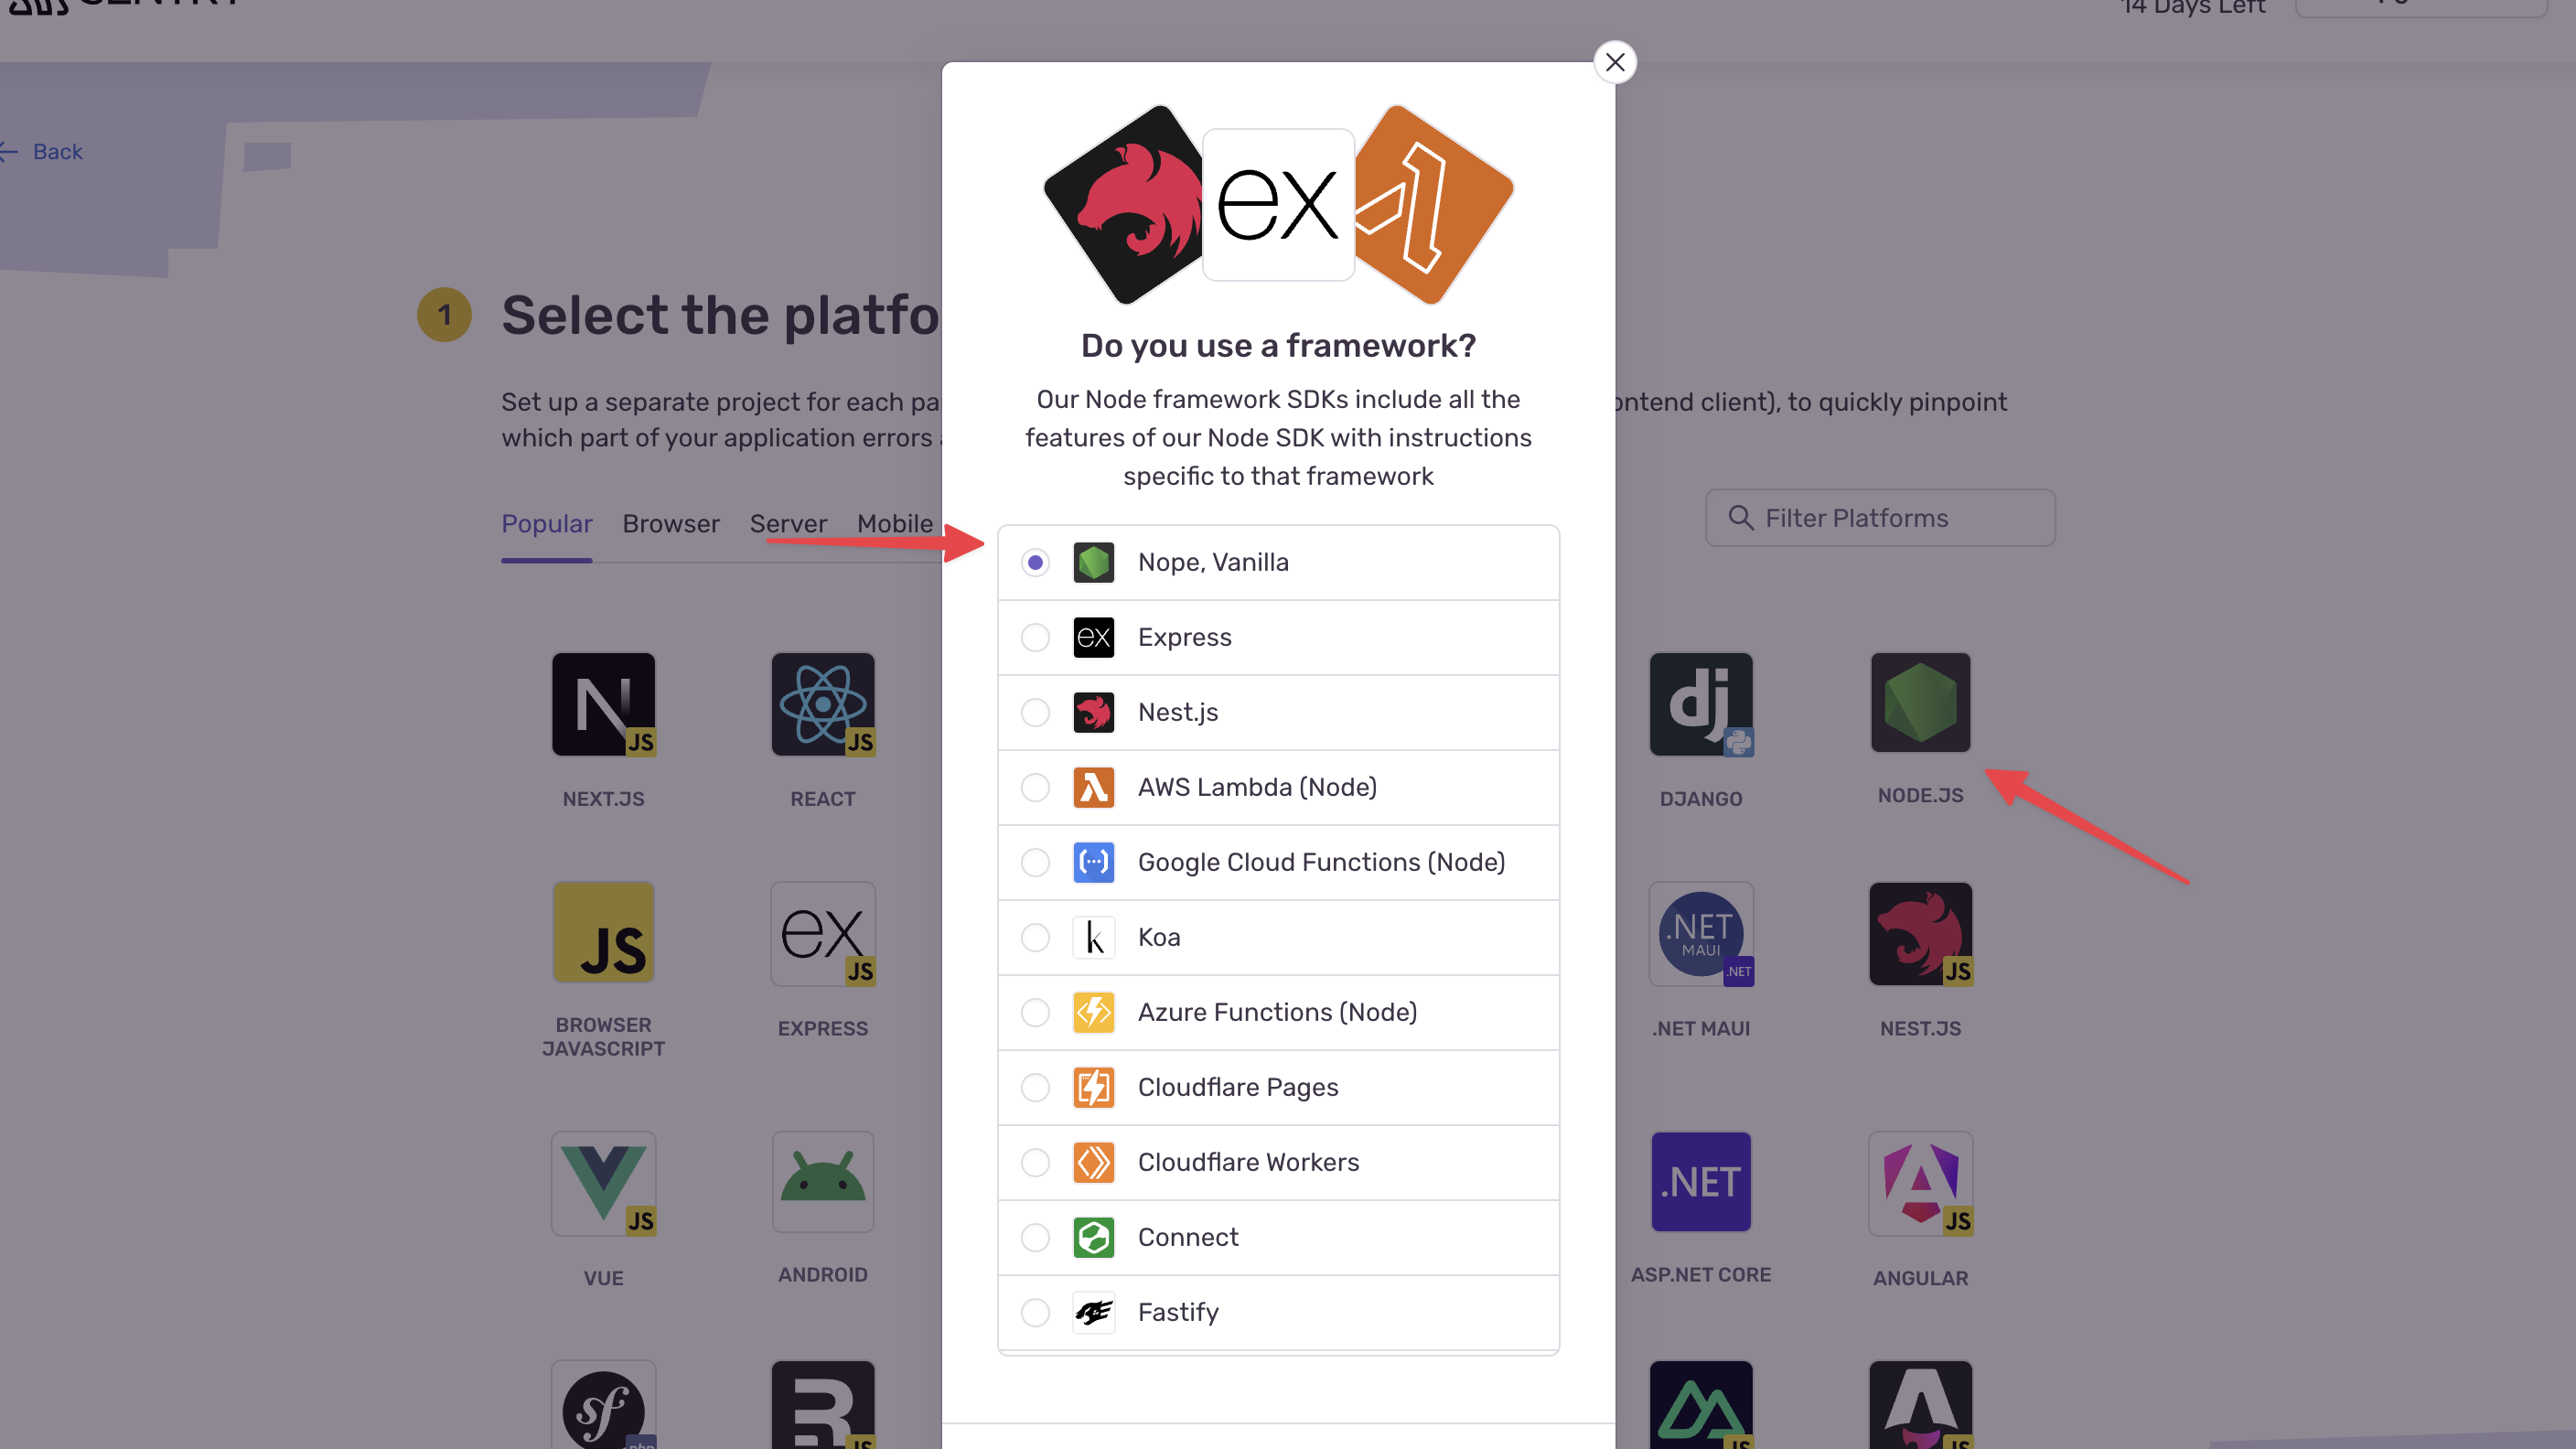
3. In the "Select Platform" step, select "Node.js" as the platform, then select "Node, Vanilla" in the pop-up.
|
|
|
|
|
|
|
|
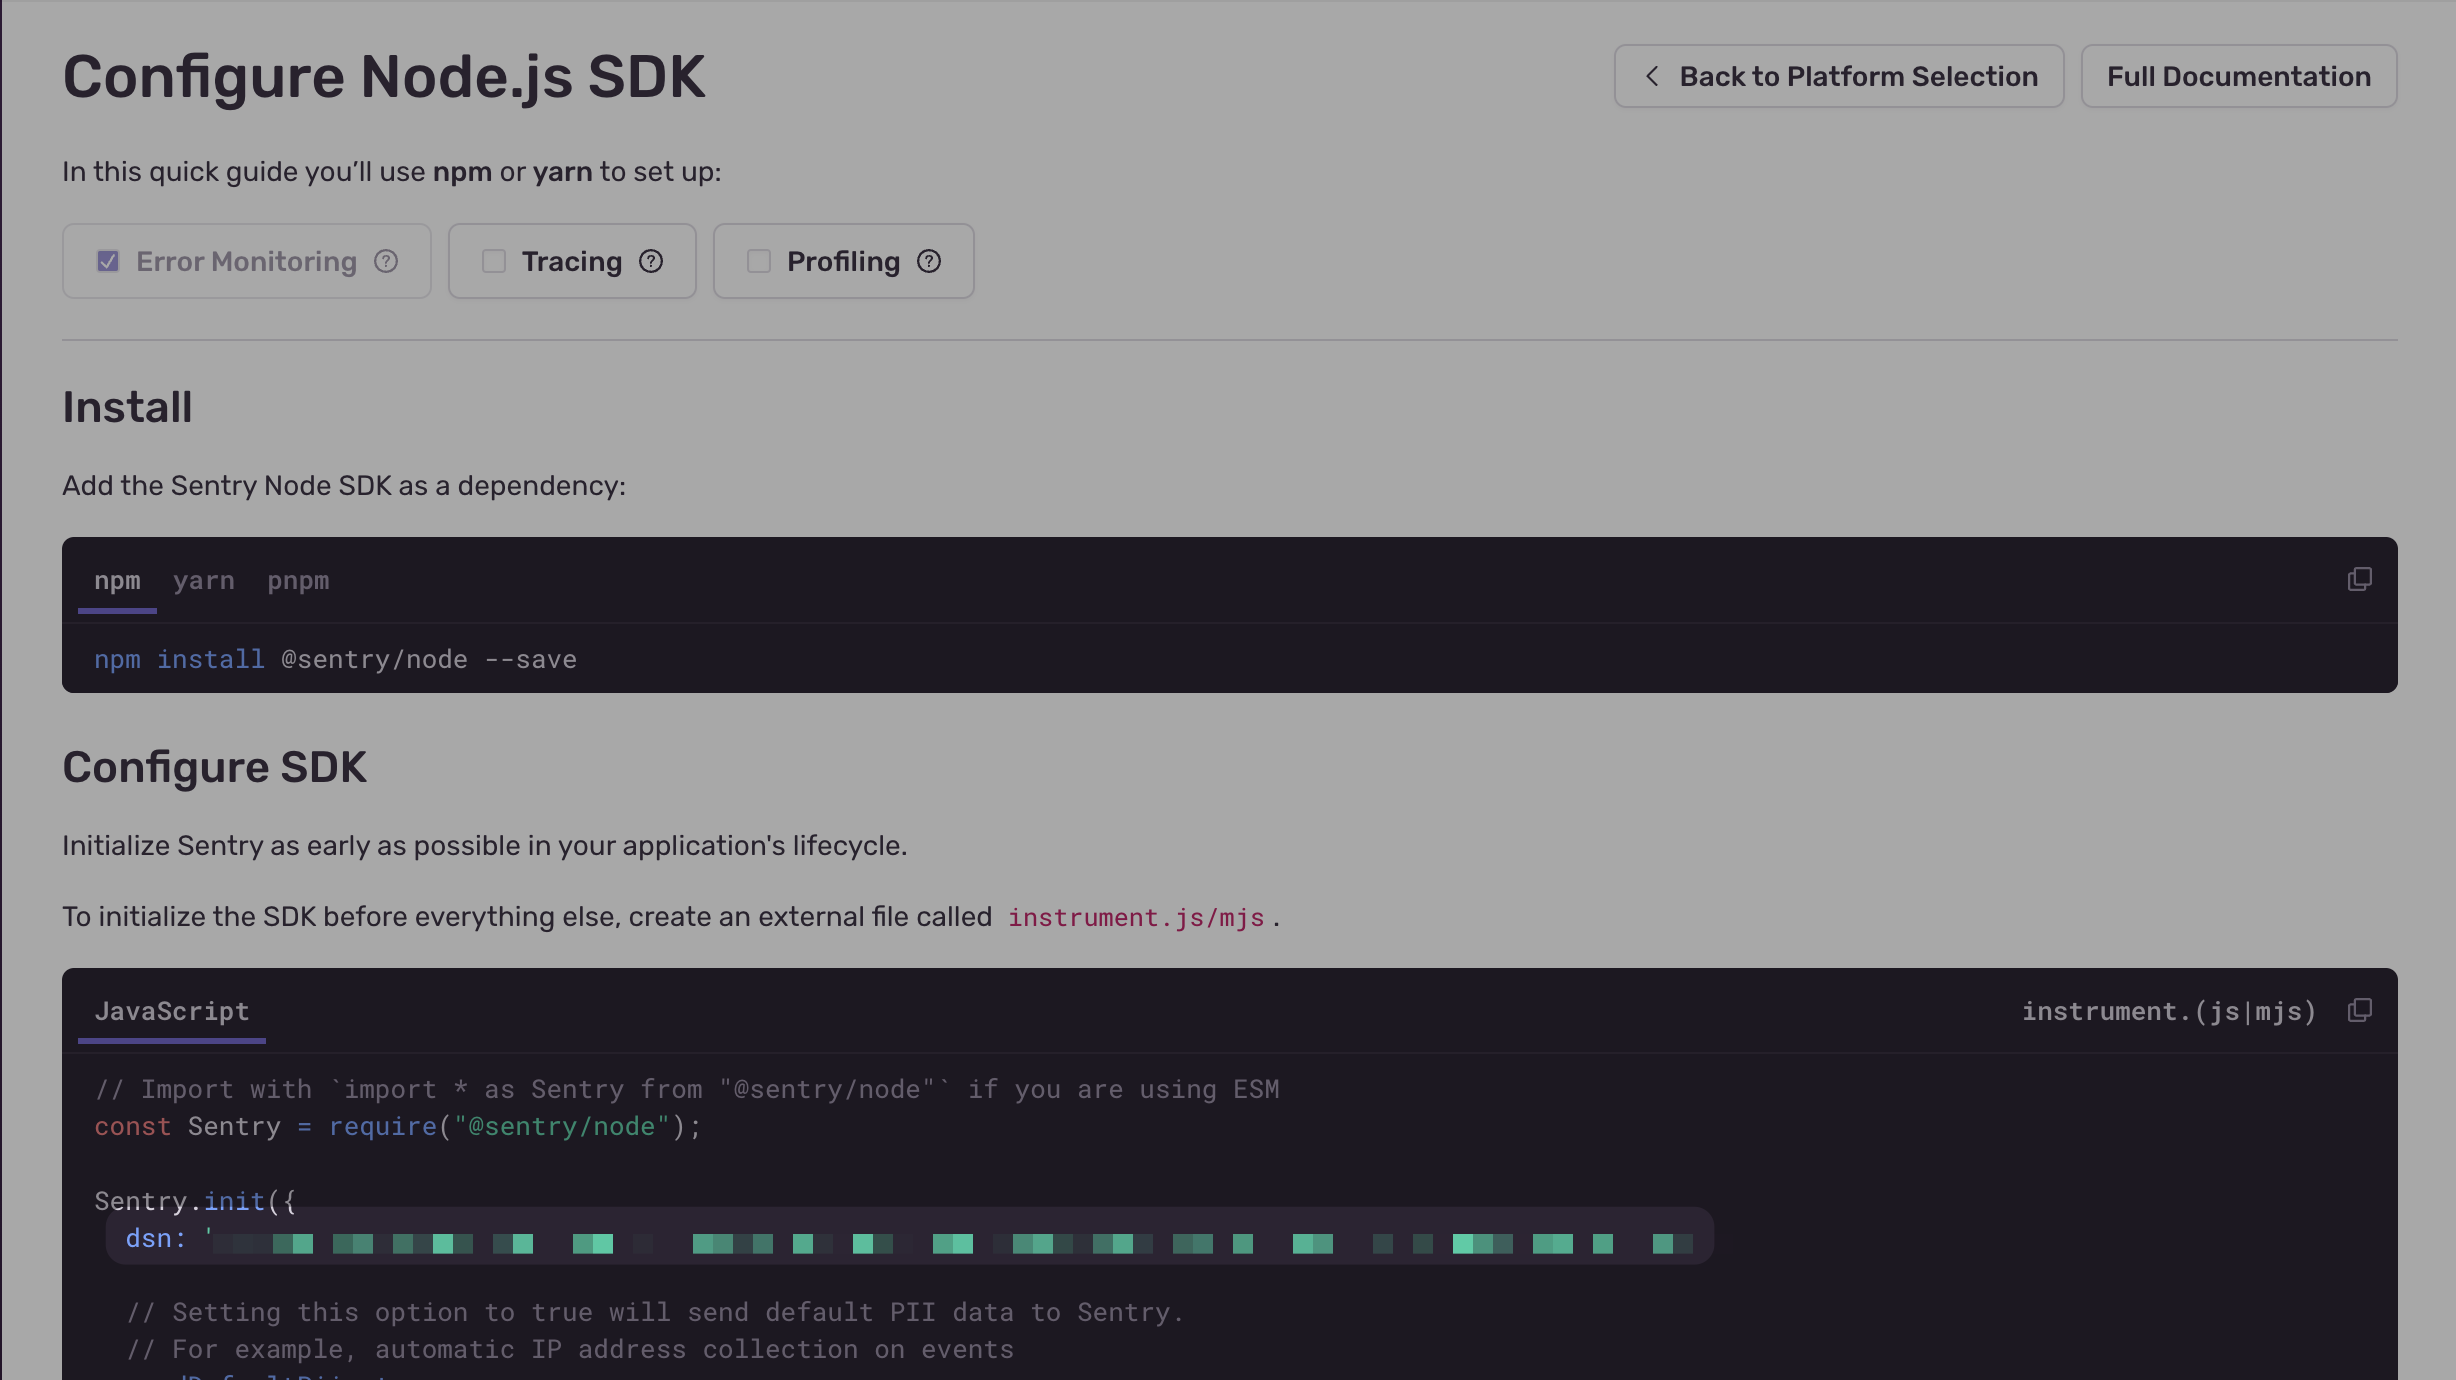
4. In the "Configure Node.js SDK" step, you can find your DSN in the second code block. Copy the DSN, as you'll need it in the next step.
|
|
|
|
|
|
|
|
You can skip onboarding or the next steps for now. You'll test out the integration in the next step.
|
|
|
|
Then, add the following environment variable to your `.env` file in your Medusa application:
|
|
|
|
```shell title=".env"
|
|
SENTRY_DSN=your_sentry_dsn_here
|
|
```
|
|
|
|
Replace `your_sentry_dsn_here` with the DSN you copied from Sentry.
|
|
|
|
### Test Tracing in Sentry
|
|
|
|
You can now test the integration to ensure operations are traced in Sentry.
|
|
|
|
First, start your Medusa application by running the following command in your Medusa application's directory:
|
|
|
|
```bash npm2yarn
|
|
npm run dev
|
|
```
|
|
|
|
You'll find in the terminal the following message:
|
|
|
|
```bash
|
|
info: OTEL registered
|
|
```
|
|
This message indicates that OpenTelemetry has been successfully registered and instrumentation is set up successfully.
|
|
|
|
Then, open your Medusa Admin dashboard in your browser at `http://localhost:9000/app` and log in with the user you created earlier.
|
|
|
|
You can already find the database, workflow executions, and HTTP requests traced in your Sentry project:
|
|
|
|
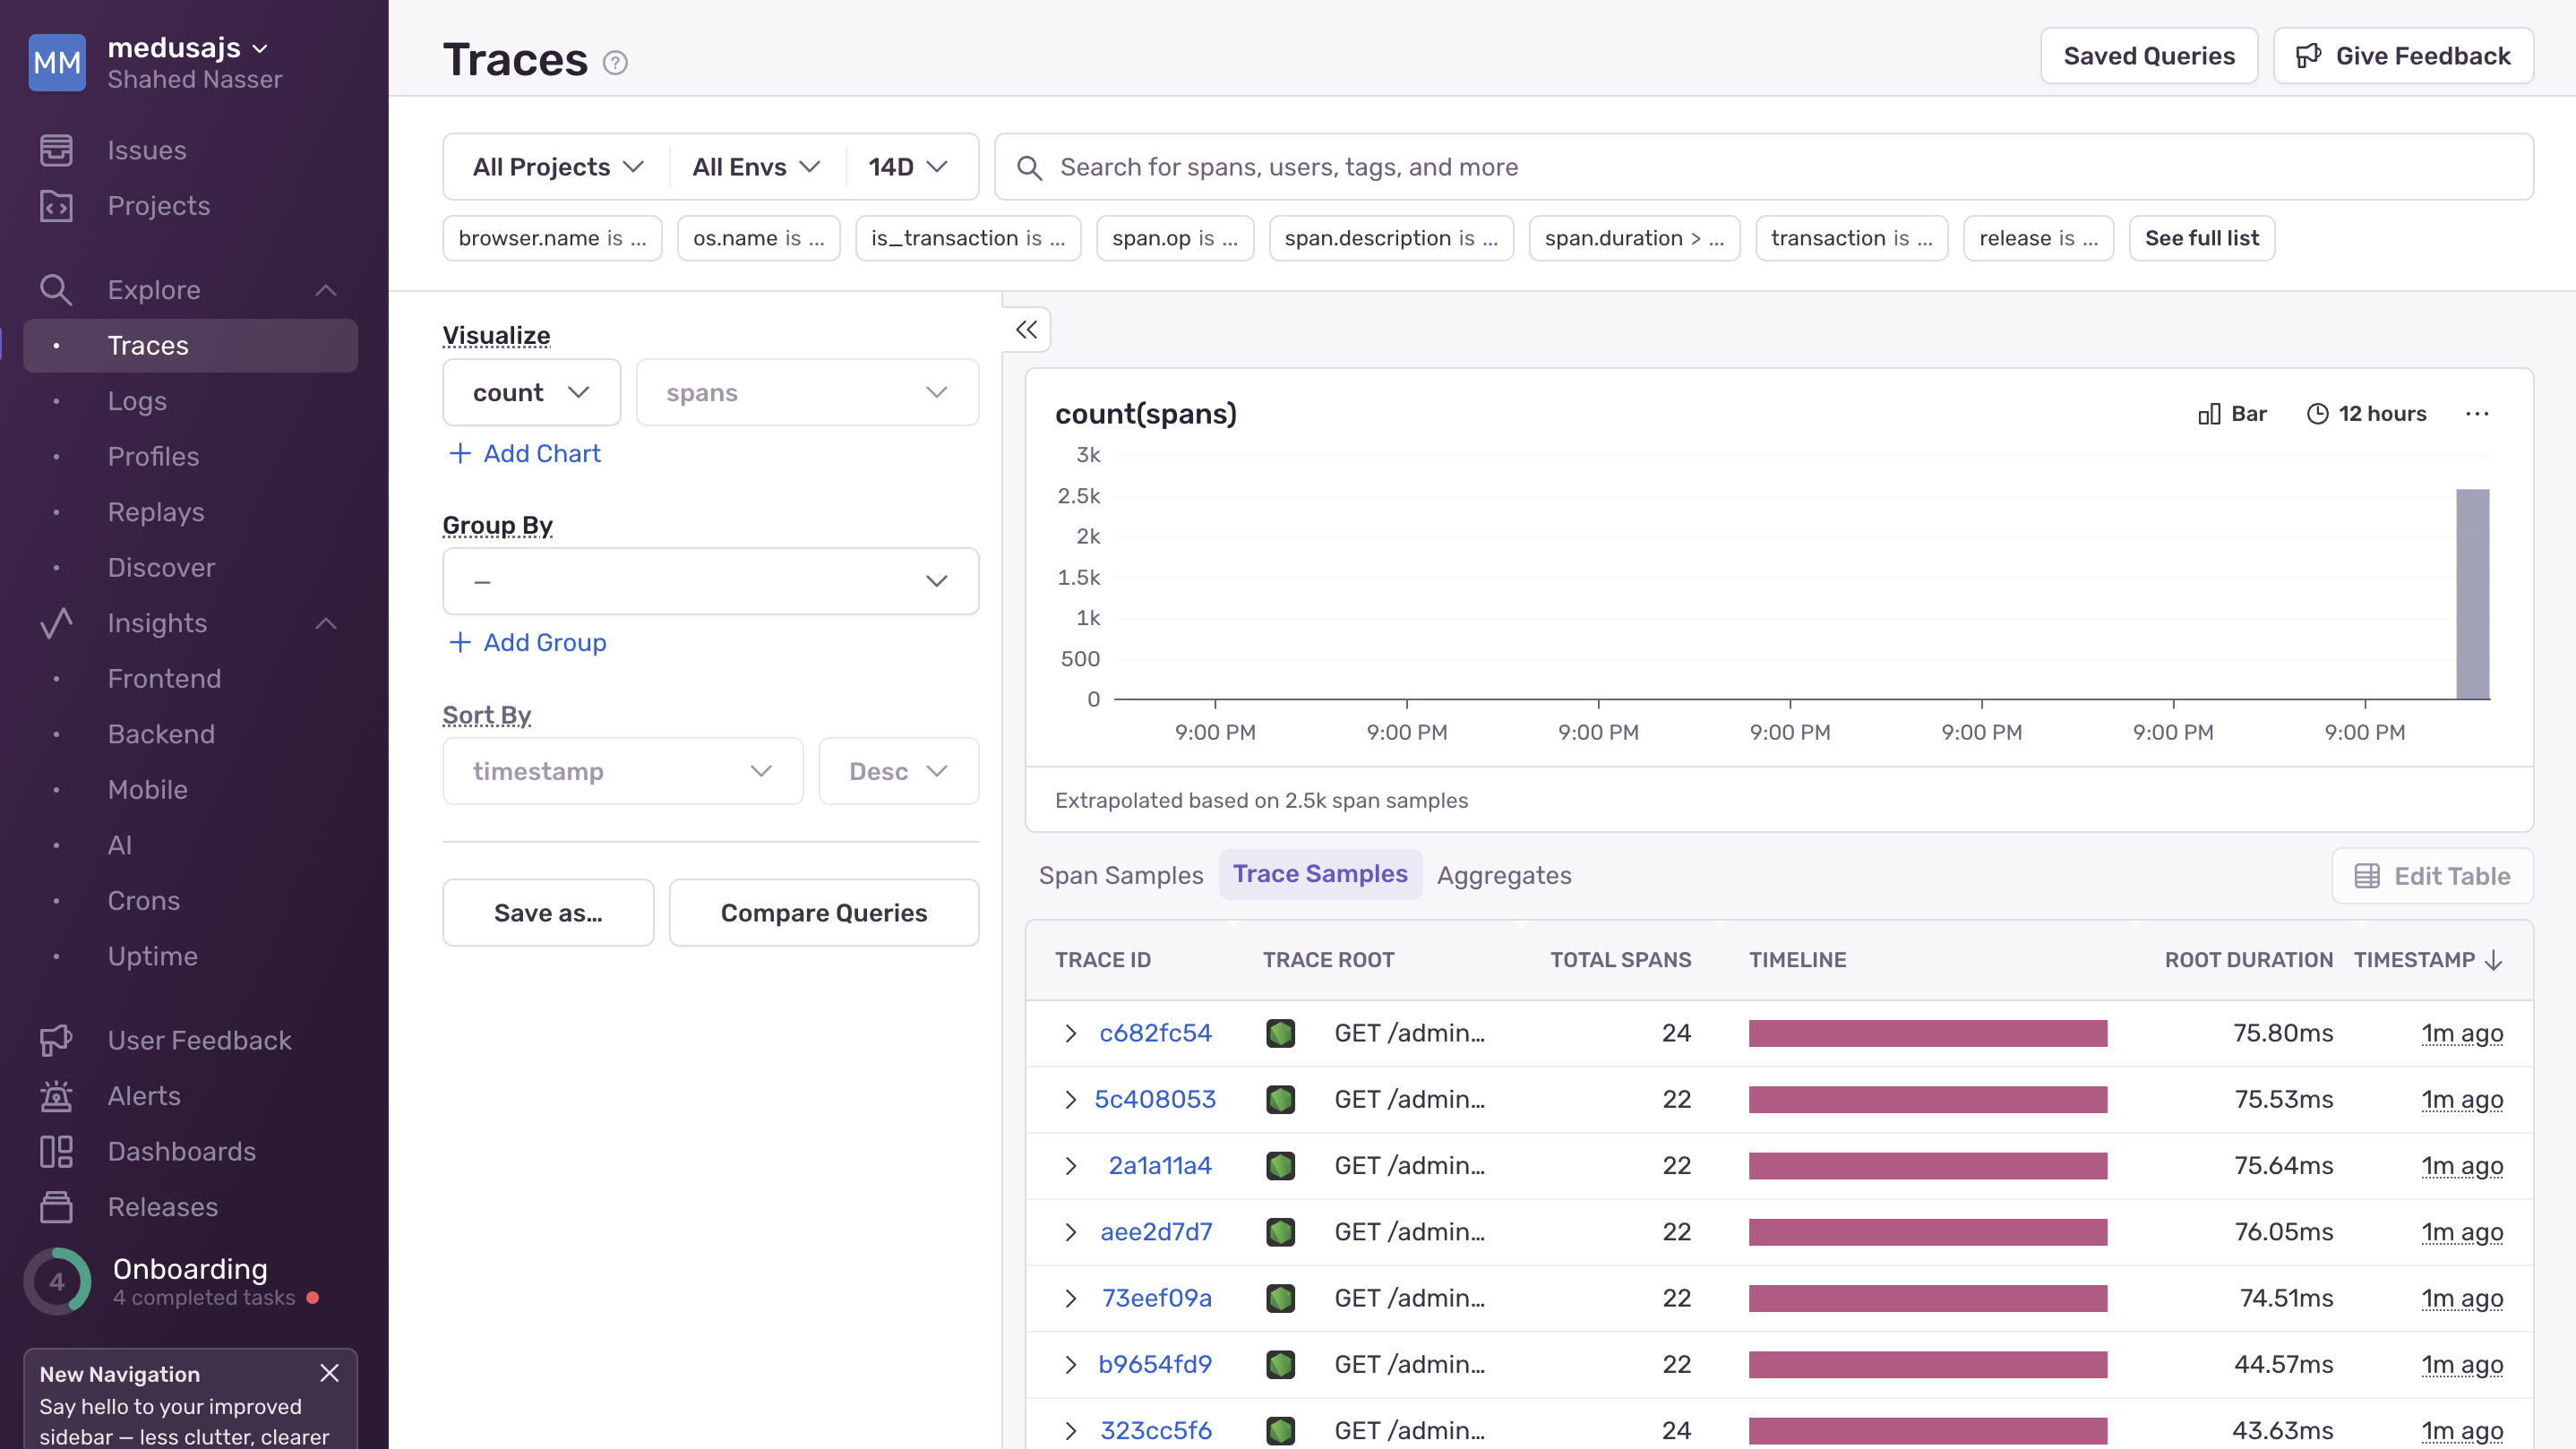
1. In your Sentry dashboard, go to Explore → Traces from the sidebar.
|
|
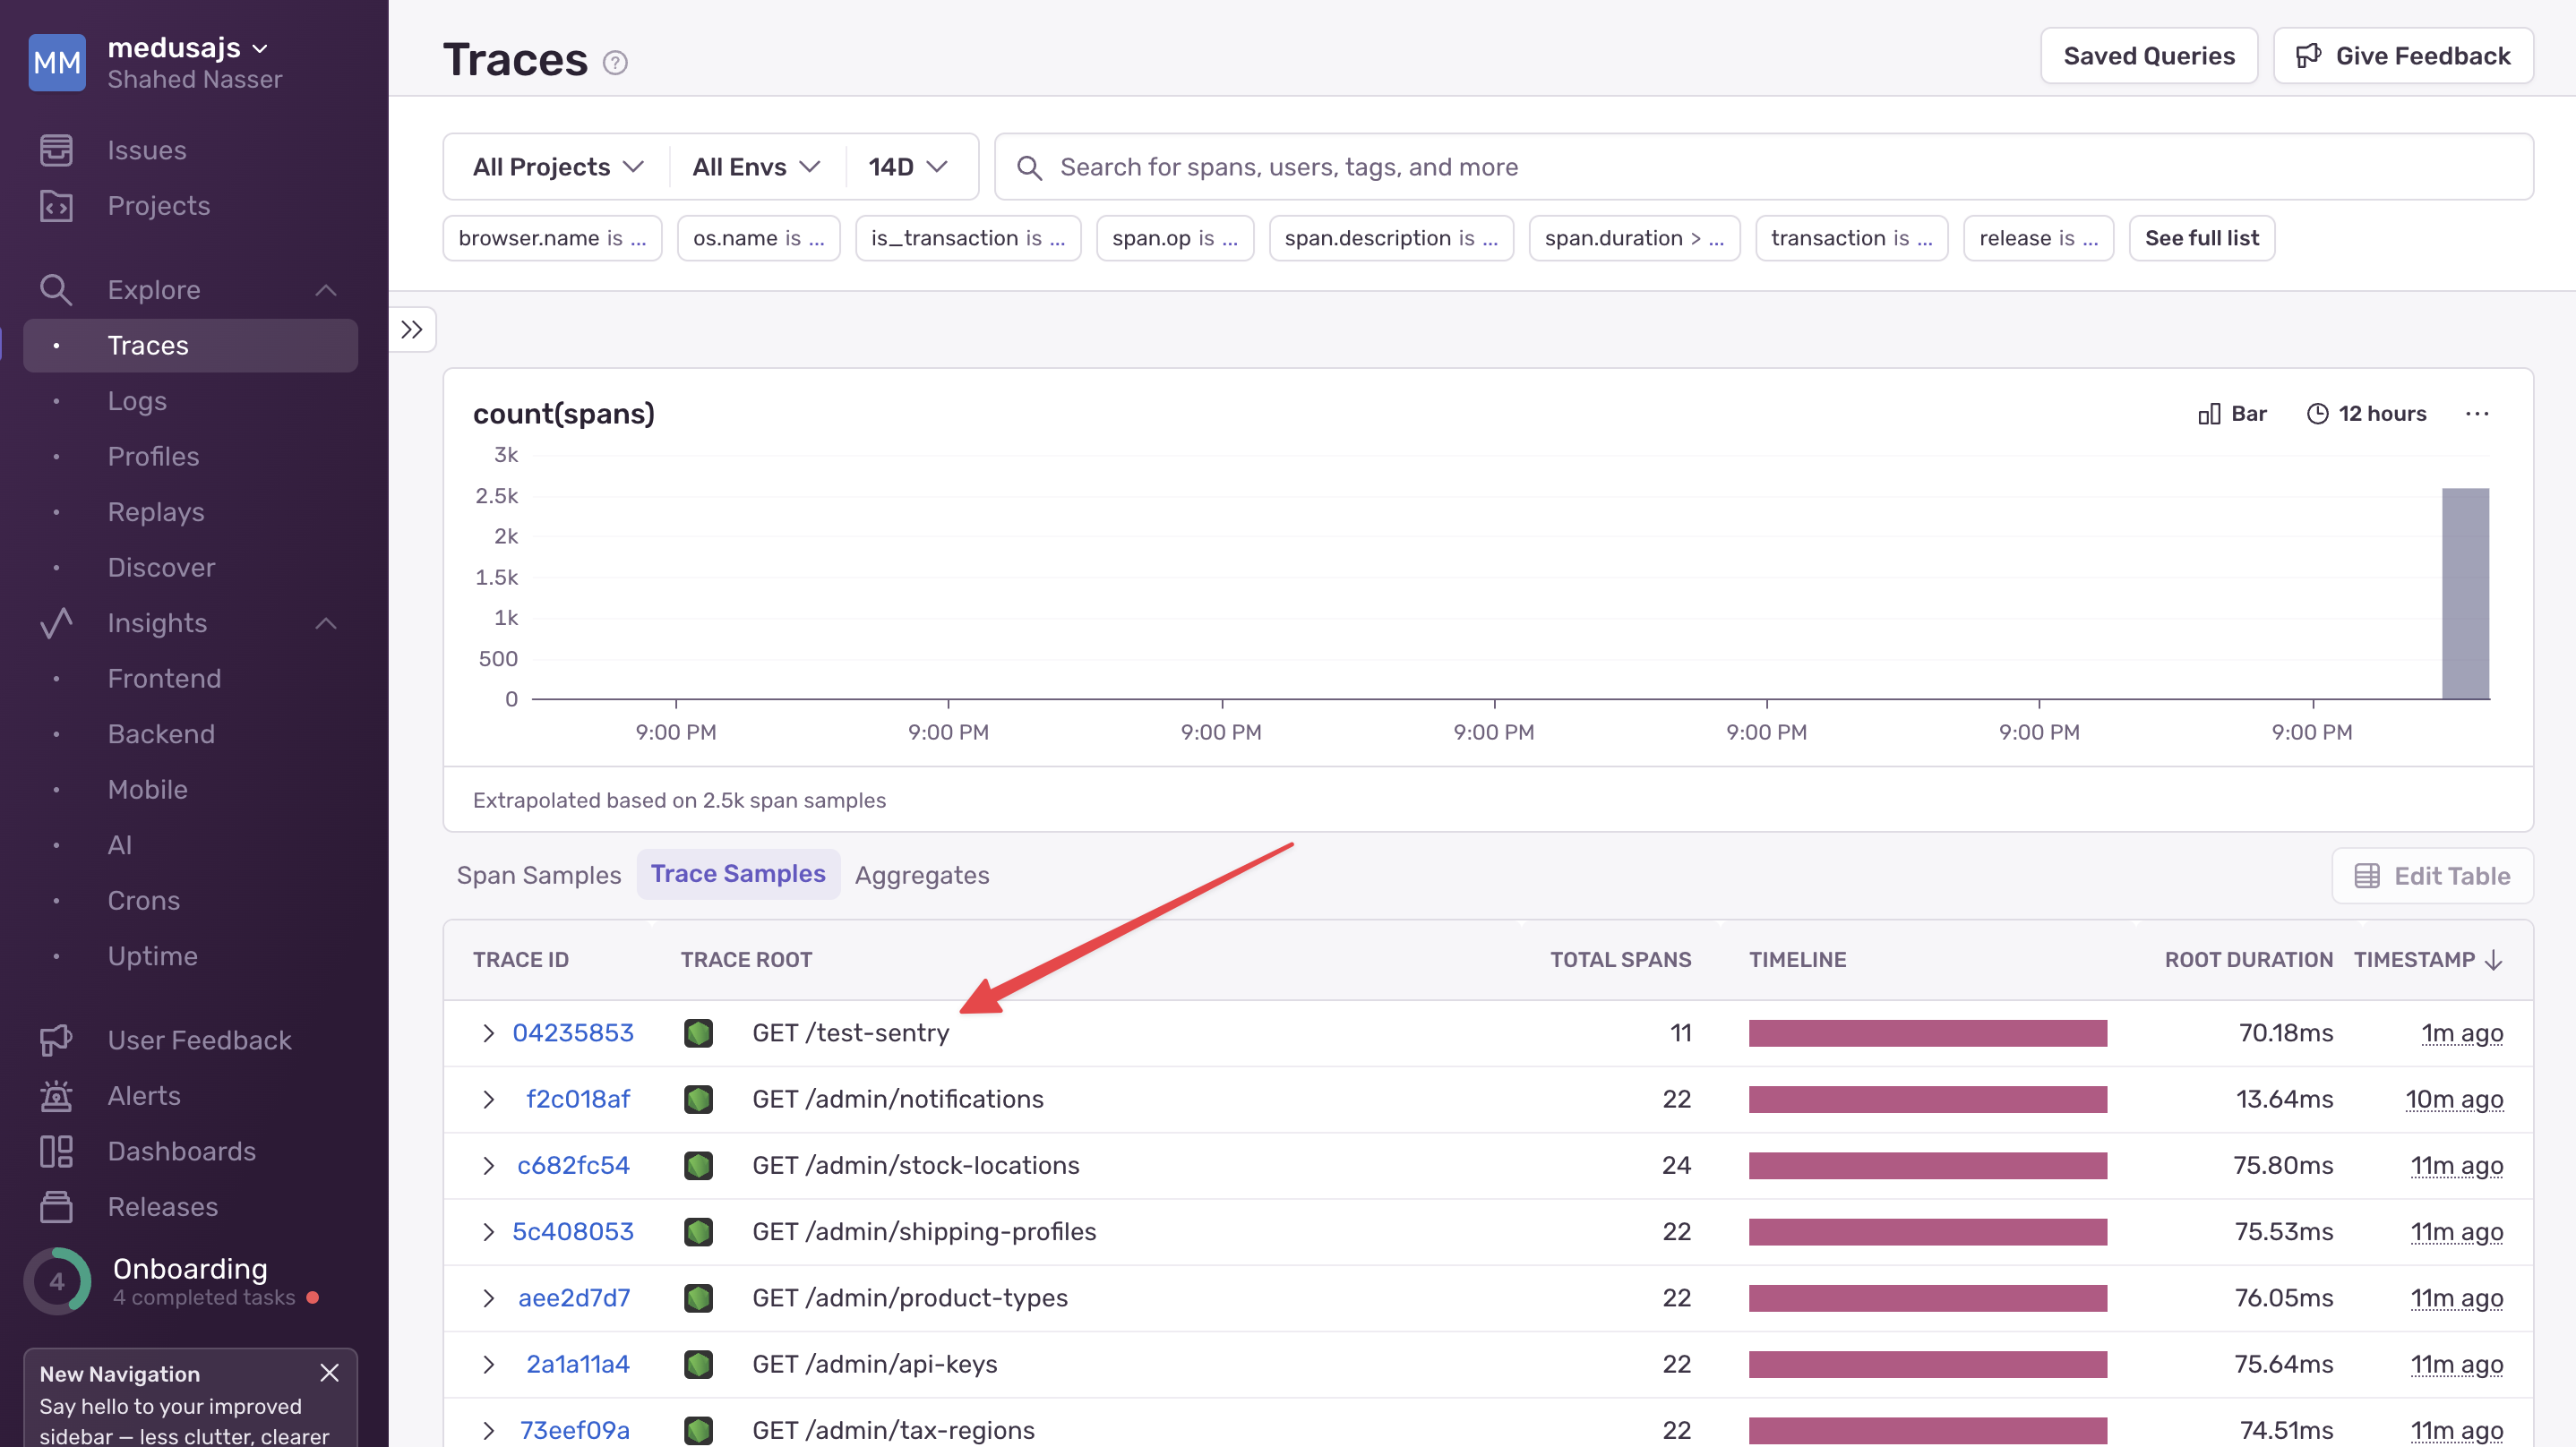
2. You'll find a list of traces on this page, including HTTP requests made to log in to the Medusa Admin dashboard.
|
|
|
|
|
|
|
|
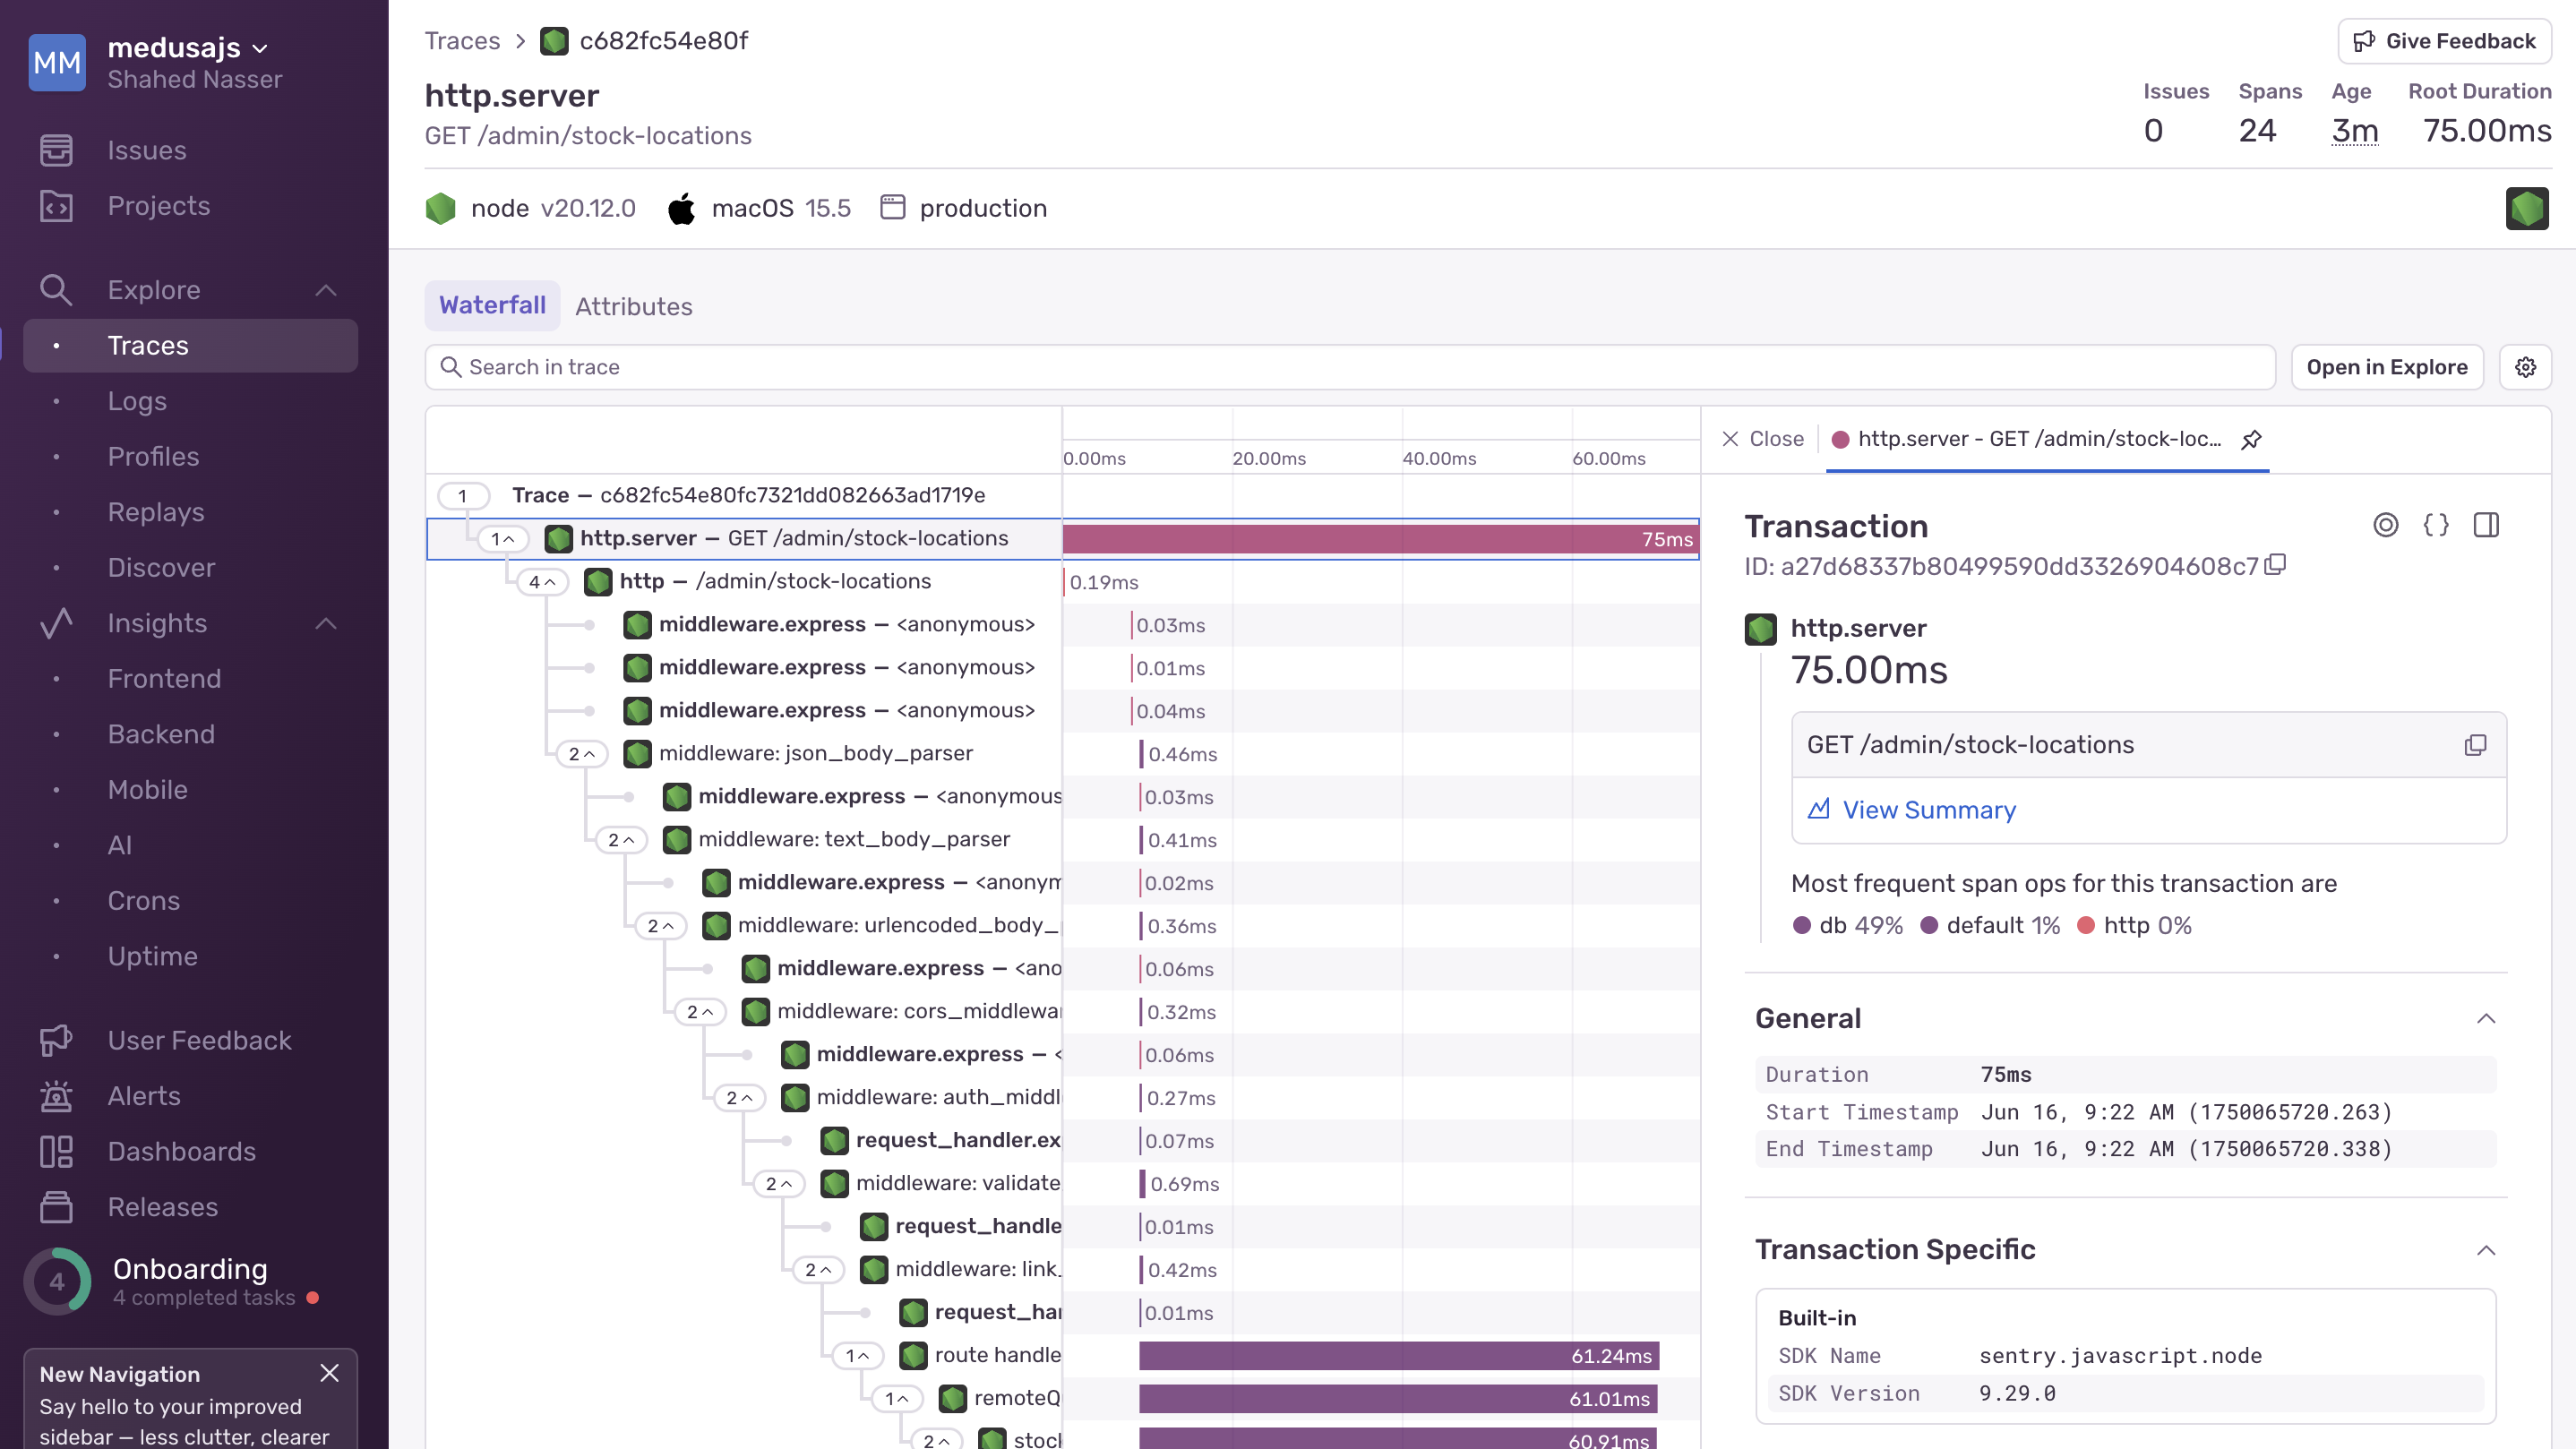
If you click on a trace, you can see more details about the trace. For example, if you click on an HTTP request trace, you can see the middlewares and workflows executed, the time taken for each operation, the status of the request, and more.
|
|
|
|
|
|
|
|
### Test Tracing for Customizations
|
|
|
|
Tracing also works for your custom API routes, workflow executions, Query usages, and database operations.
|
|
|
|
In this section, you'll test it by creating a custom API route that throws an error. For now, you'll only view its tracing in Sentry. Later, you'll configure capturing HTTP request errors in Sentry.
|
|
|
|
<Note title="Tip">
|
|
|
|
An [API Route](!docs!/learn/fundamentals/api-routes) is an endpoint that exposes commerce features to external applications and clients, such as storefronts.
|
|
|
|
</Note>
|
|
|
|
An API route is created in a `route.ts` file under a sub-directory of the `src/api` directory. The path of the API route is the file's path relative to `src/api`.
|
|
|
|
So, to create an API route at the path `/test-sentry`, create the file `src/api/test-sentry/route.ts` with the following content:
|
|
|
|
```ts title="src/api/test-sentry/route.ts"
|
|
import { MedusaRequest, MedusaResponse } from "@medusajs/framework/http"
|
|
import { MedusaError } from "@medusajs/framework/utils"
|
|
|
|
export async function GET(
|
|
req: MedusaRequest,
|
|
res: MedusaResponse
|
|
) {
|
|
throw new MedusaError(
|
|
MedusaError.Types.UNEXPECTED_STATE,
|
|
"This is a test error for Sentry integration."
|
|
)
|
|
}
|
|
```
|
|
|
|
Since you export a `GET` route handler function, you expose a `GET` API route at `/test-sentry`. The route handler function accepts two parameters:
|
|
|
|
1. A request object with details and context on the request, such as body parameters.
|
|
2. A response object to manipulate and send the response.
|
|
|
|
In the route handler, you throw a `MedusaError` with a custom message. This error will be returned as a response to the request. Later, when you configure error capturing in Sentry, this error will be captured and displayed in the Sentry dashboard.
|
|
|
|
To test the API route, make sure your Medusa application is running, then go to `http://localhost:9000/test-sentry` in your browser or use `curl`:
|
|
|
|
```bash
|
|
curl http://localhost:9000/test-sentry
|
|
```
|
|
|
|
You'll receive the following error in the response:
|
|
|
|
```json
|
|
{
|
|
"type": "unexpected_state",
|
|
"message": "This is a test error for Sentry integration."
|
|
}
|
|
```
|
|
|
|
If you refresh the Tracing page in your Sentry dashboard, you should see a new trace for the `/test-sentry` API route.
|
|
|
|
<Note>
|
|
|
|
It may take a few seconds for the trace to appear in Sentry, so if you don't see it immediately, wait a bit and refresh the page.
|
|
|
|
</Note>
|
|
|
|
|
|
|
|
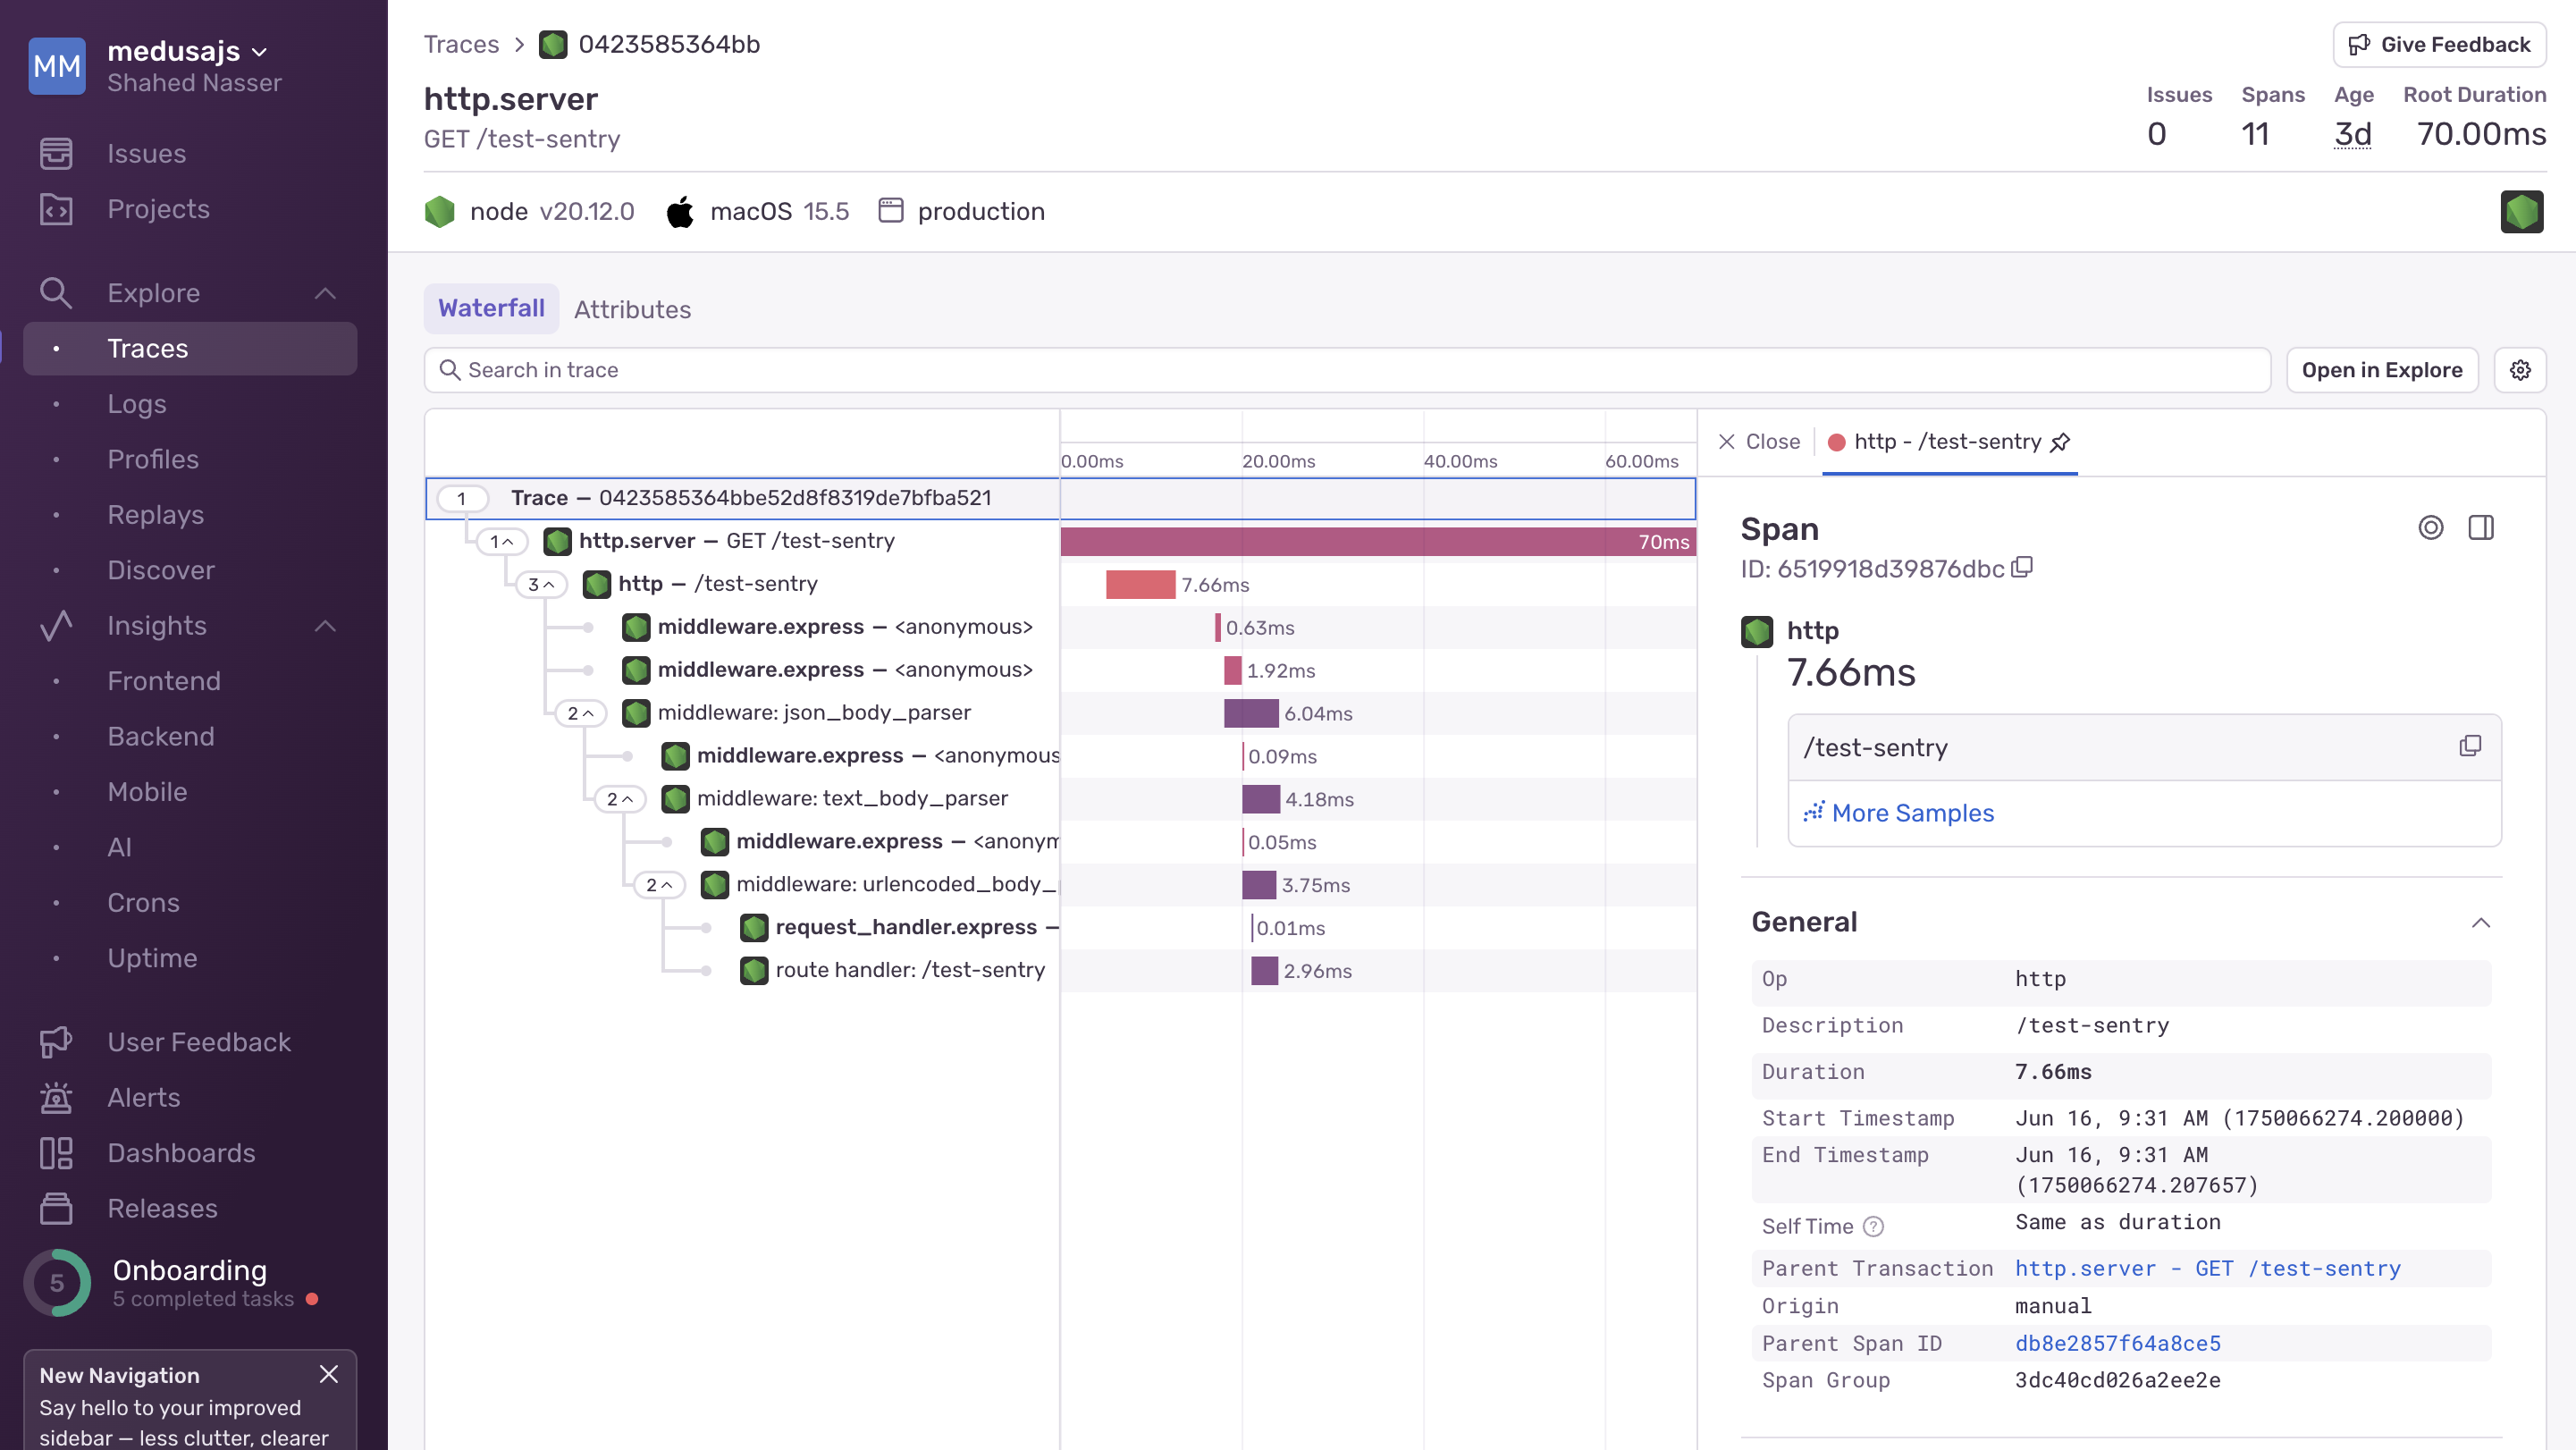
If you click on the Trace ID, you'll see the details of the trace.
|
|
|
|
|
|
|
|
---
|
|
|
|
## Step 3: Capture HTTP Request Errors in Sentry
|
|
|
|
In the previous step, you tested tracing in Sentry by creating a custom API route that throws an error. However, the error was not captured by Sentry. So, you couldn't see the error details in the Sentry dashboard or get notified about it.
|
|
|
|
In this step, you'll capture HTTP request errors in Sentry. You'll do that by customizing Medusa's default error handler that is used to handle errors in API routes.
|
|
|
|
<Note>
|
|
|
|
Refer to the [Throwing and Handling Errors](!docs!/learn/fundamentals/api-routes/errors) guide to learn more about Medusa's default error handling behavior.
|
|
|
|
</Note>
|
|
|
|
To customize the error handler, create the file `src/api/middlewares.ts` with the following content:
|
|
|
|
export const errorHandlerHighlights = [
|
|
["20", "captureException", "Capture the error in Sentry."],
|
|
["21", "originalErrorHandler", "Call Medusa's default error handler."],
|
|
]
|
|
|
|
```ts title="src/api/middlewares.ts" highlights={errorHandlerHighlights}
|
|
import {
|
|
defineMiddlewares,
|
|
errorHandler,
|
|
MedusaNextFunction,
|
|
MedusaRequest,
|
|
MedusaResponse,
|
|
} from "@medusajs/framework/http"
|
|
import { MedusaError } from "@medusajs/framework/utils"
|
|
import * as Sentry from "@sentry/node"
|
|
|
|
const originalErrorHandler = errorHandler()
|
|
|
|
export default defineMiddlewares({
|
|
errorHandler: (
|
|
error: MedusaError | any,
|
|
req: MedusaRequest,
|
|
res: MedusaResponse,
|
|
next: MedusaNextFunction
|
|
) => {
|
|
Sentry.captureException(error)
|
|
return originalErrorHandler(error, req, res, next)
|
|
},
|
|
})
|
|
```
|
|
|
|
You export the `defineMiddlewares` function that allows you to apply middlewares and customize Medusa's default error handler.
|
|
|
|
The function accepts an object with the `errorHandler` property, whose value is a custom function that handles errors thrown in API routes.
|
|
|
|
In the custom error handler, you first capture the error in Sentry using `Sentry.captureException(error)`. This allows Sentry to track the error and its context.
|
|
|
|
Then, you call the original error handler function that Medusa uses to handle errors in API routes. By using this function, you retain Medusa's default error handling behavior of returning the error response to the client.
|
|
|
|
### Test Error Capturing in Sentry
|
|
|
|
To test out error capturing in Sentry, start the Medusa application if it's not already running:
|
|
|
|
```bash npm2yarn
|
|
npm run dev
|
|
```
|
|
|
|
Then, send a `GET` request to the `/test-sentry` API route you created earlier:
|
|
|
|
```bash
|
|
curl http://localhost:9000/test-sentry
|
|
```
|
|
|
|
You'll receive the same error response as before:
|
|
|
|
```json
|
|
{
|
|
"type": "unexpected_state",
|
|
"message": "This is a test error for Sentry integration."
|
|
}
|
|
```
|
|
|
|
If you check the tracing page in your Sentry dashboard, you'll see a new trace for the `/test-sentry` API route. Click on it to view the details.
|
|
|
|
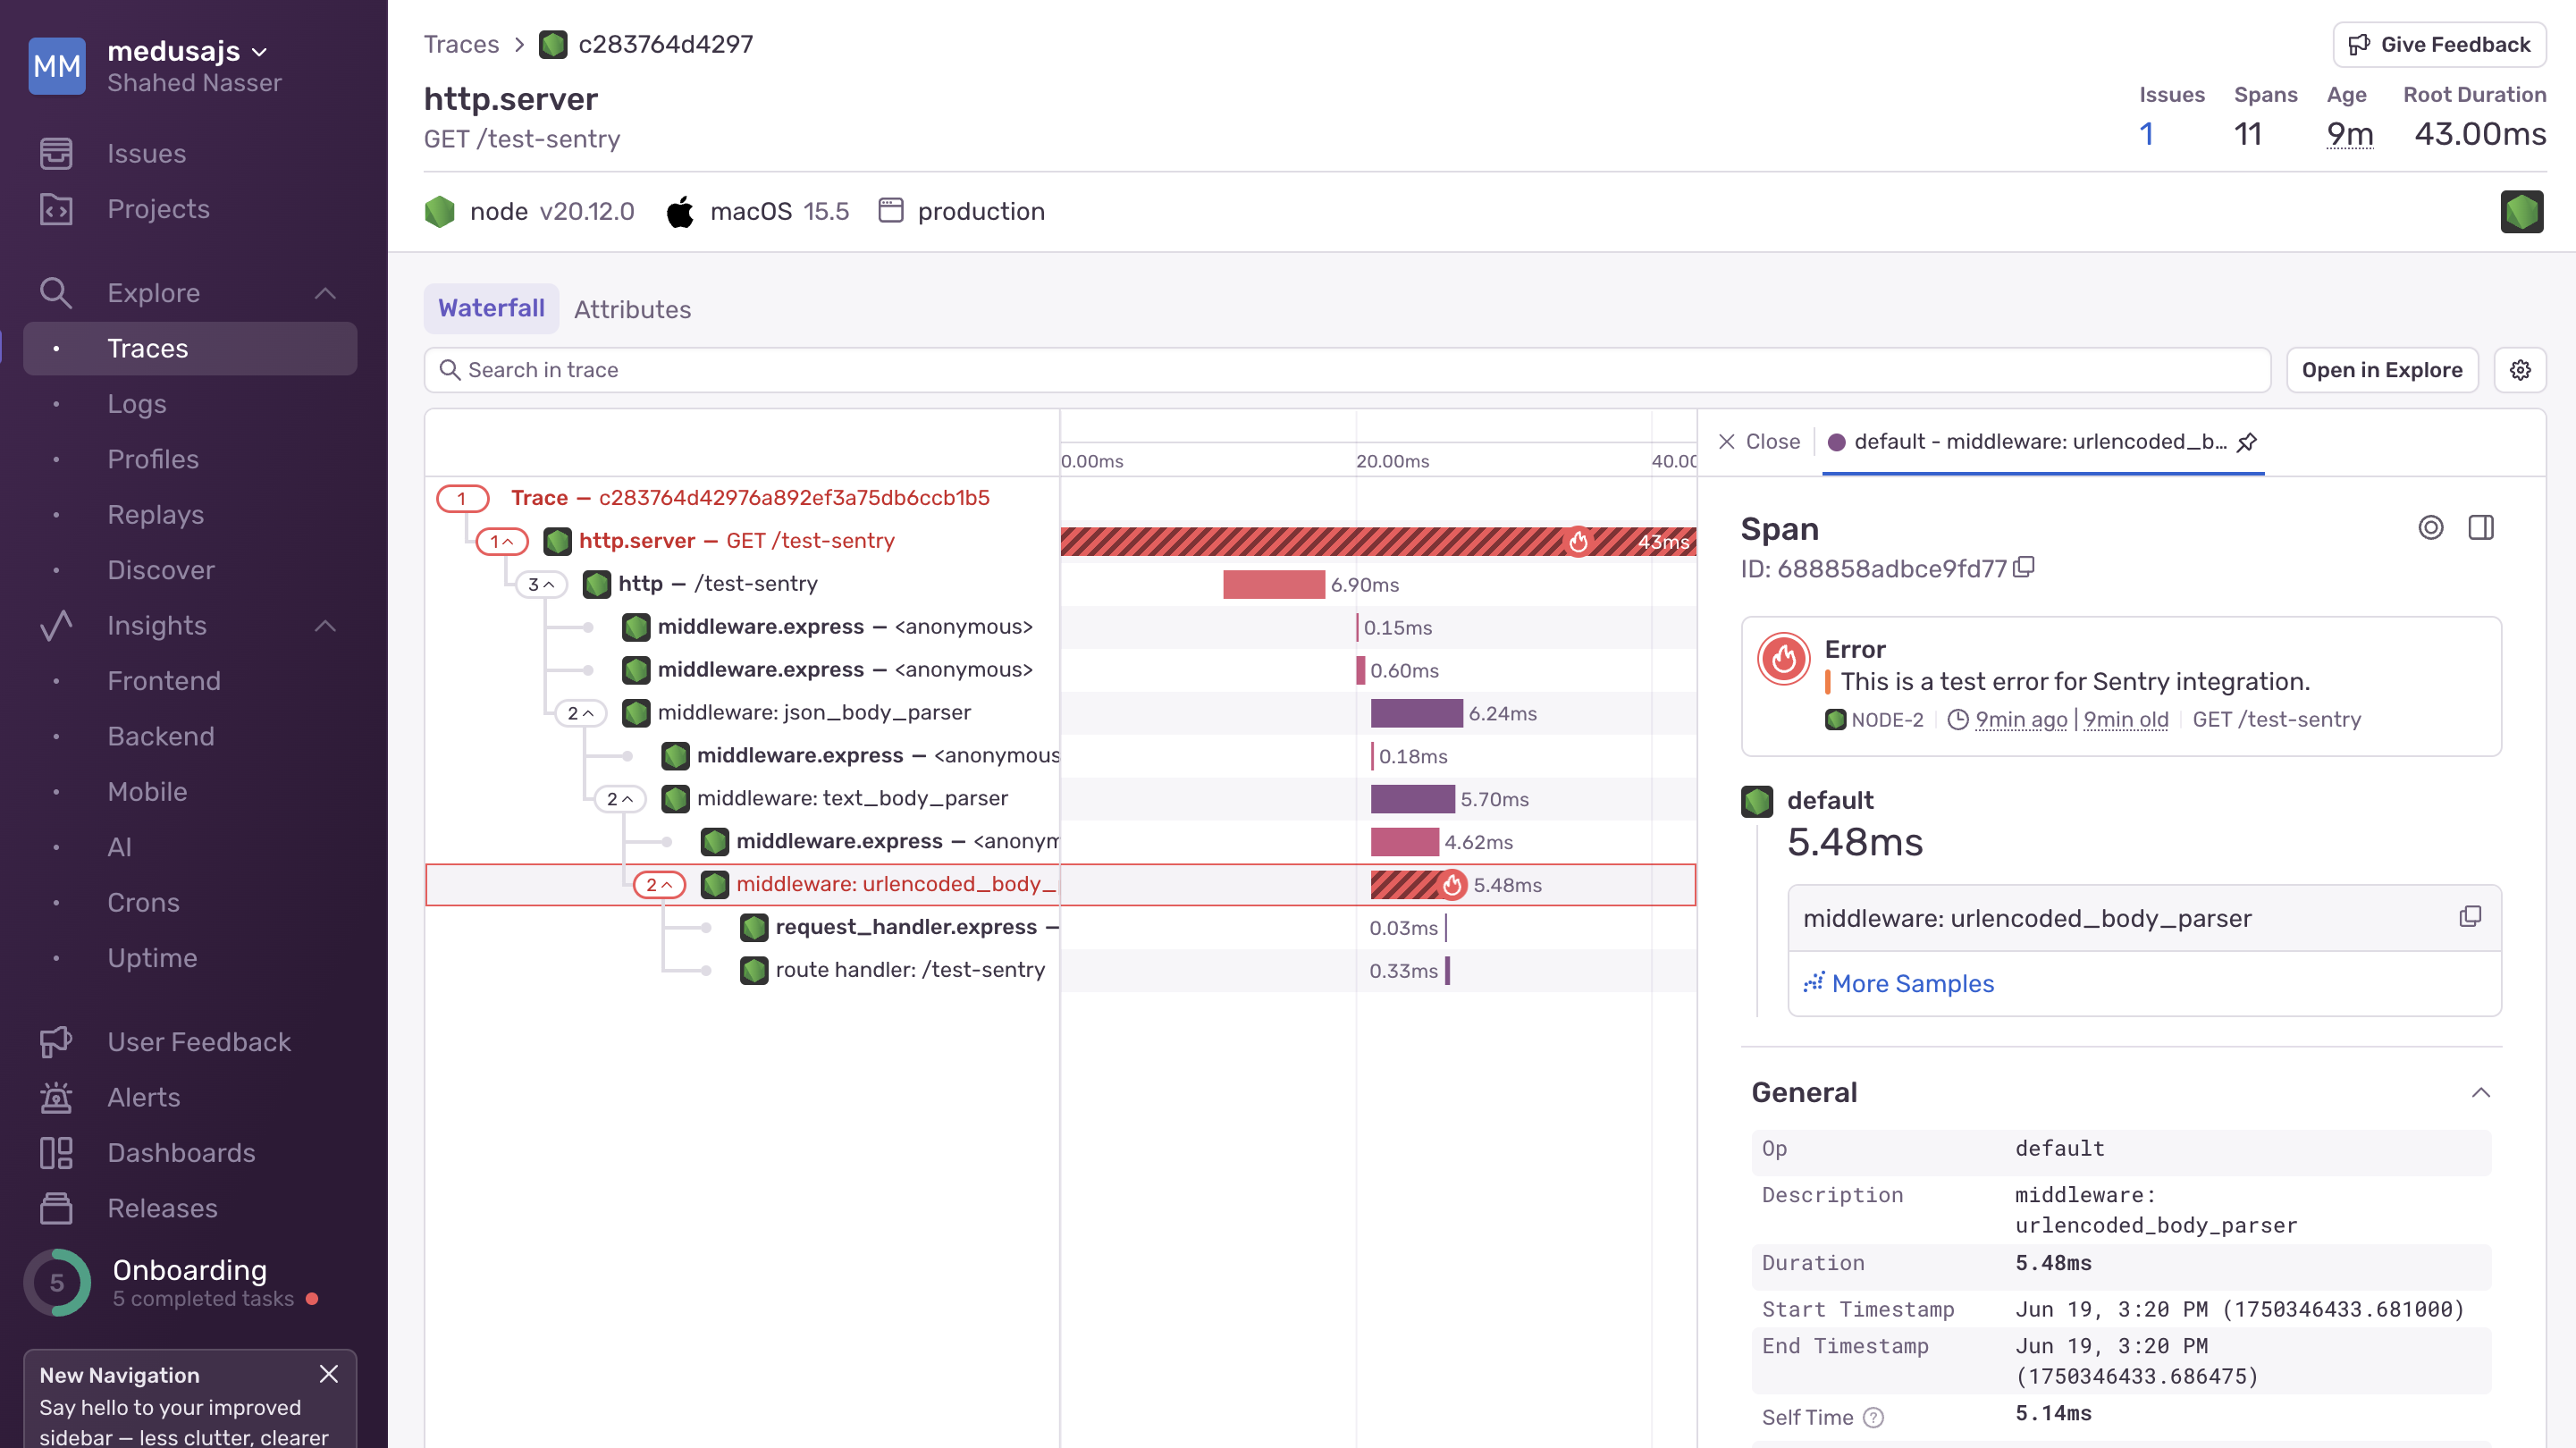
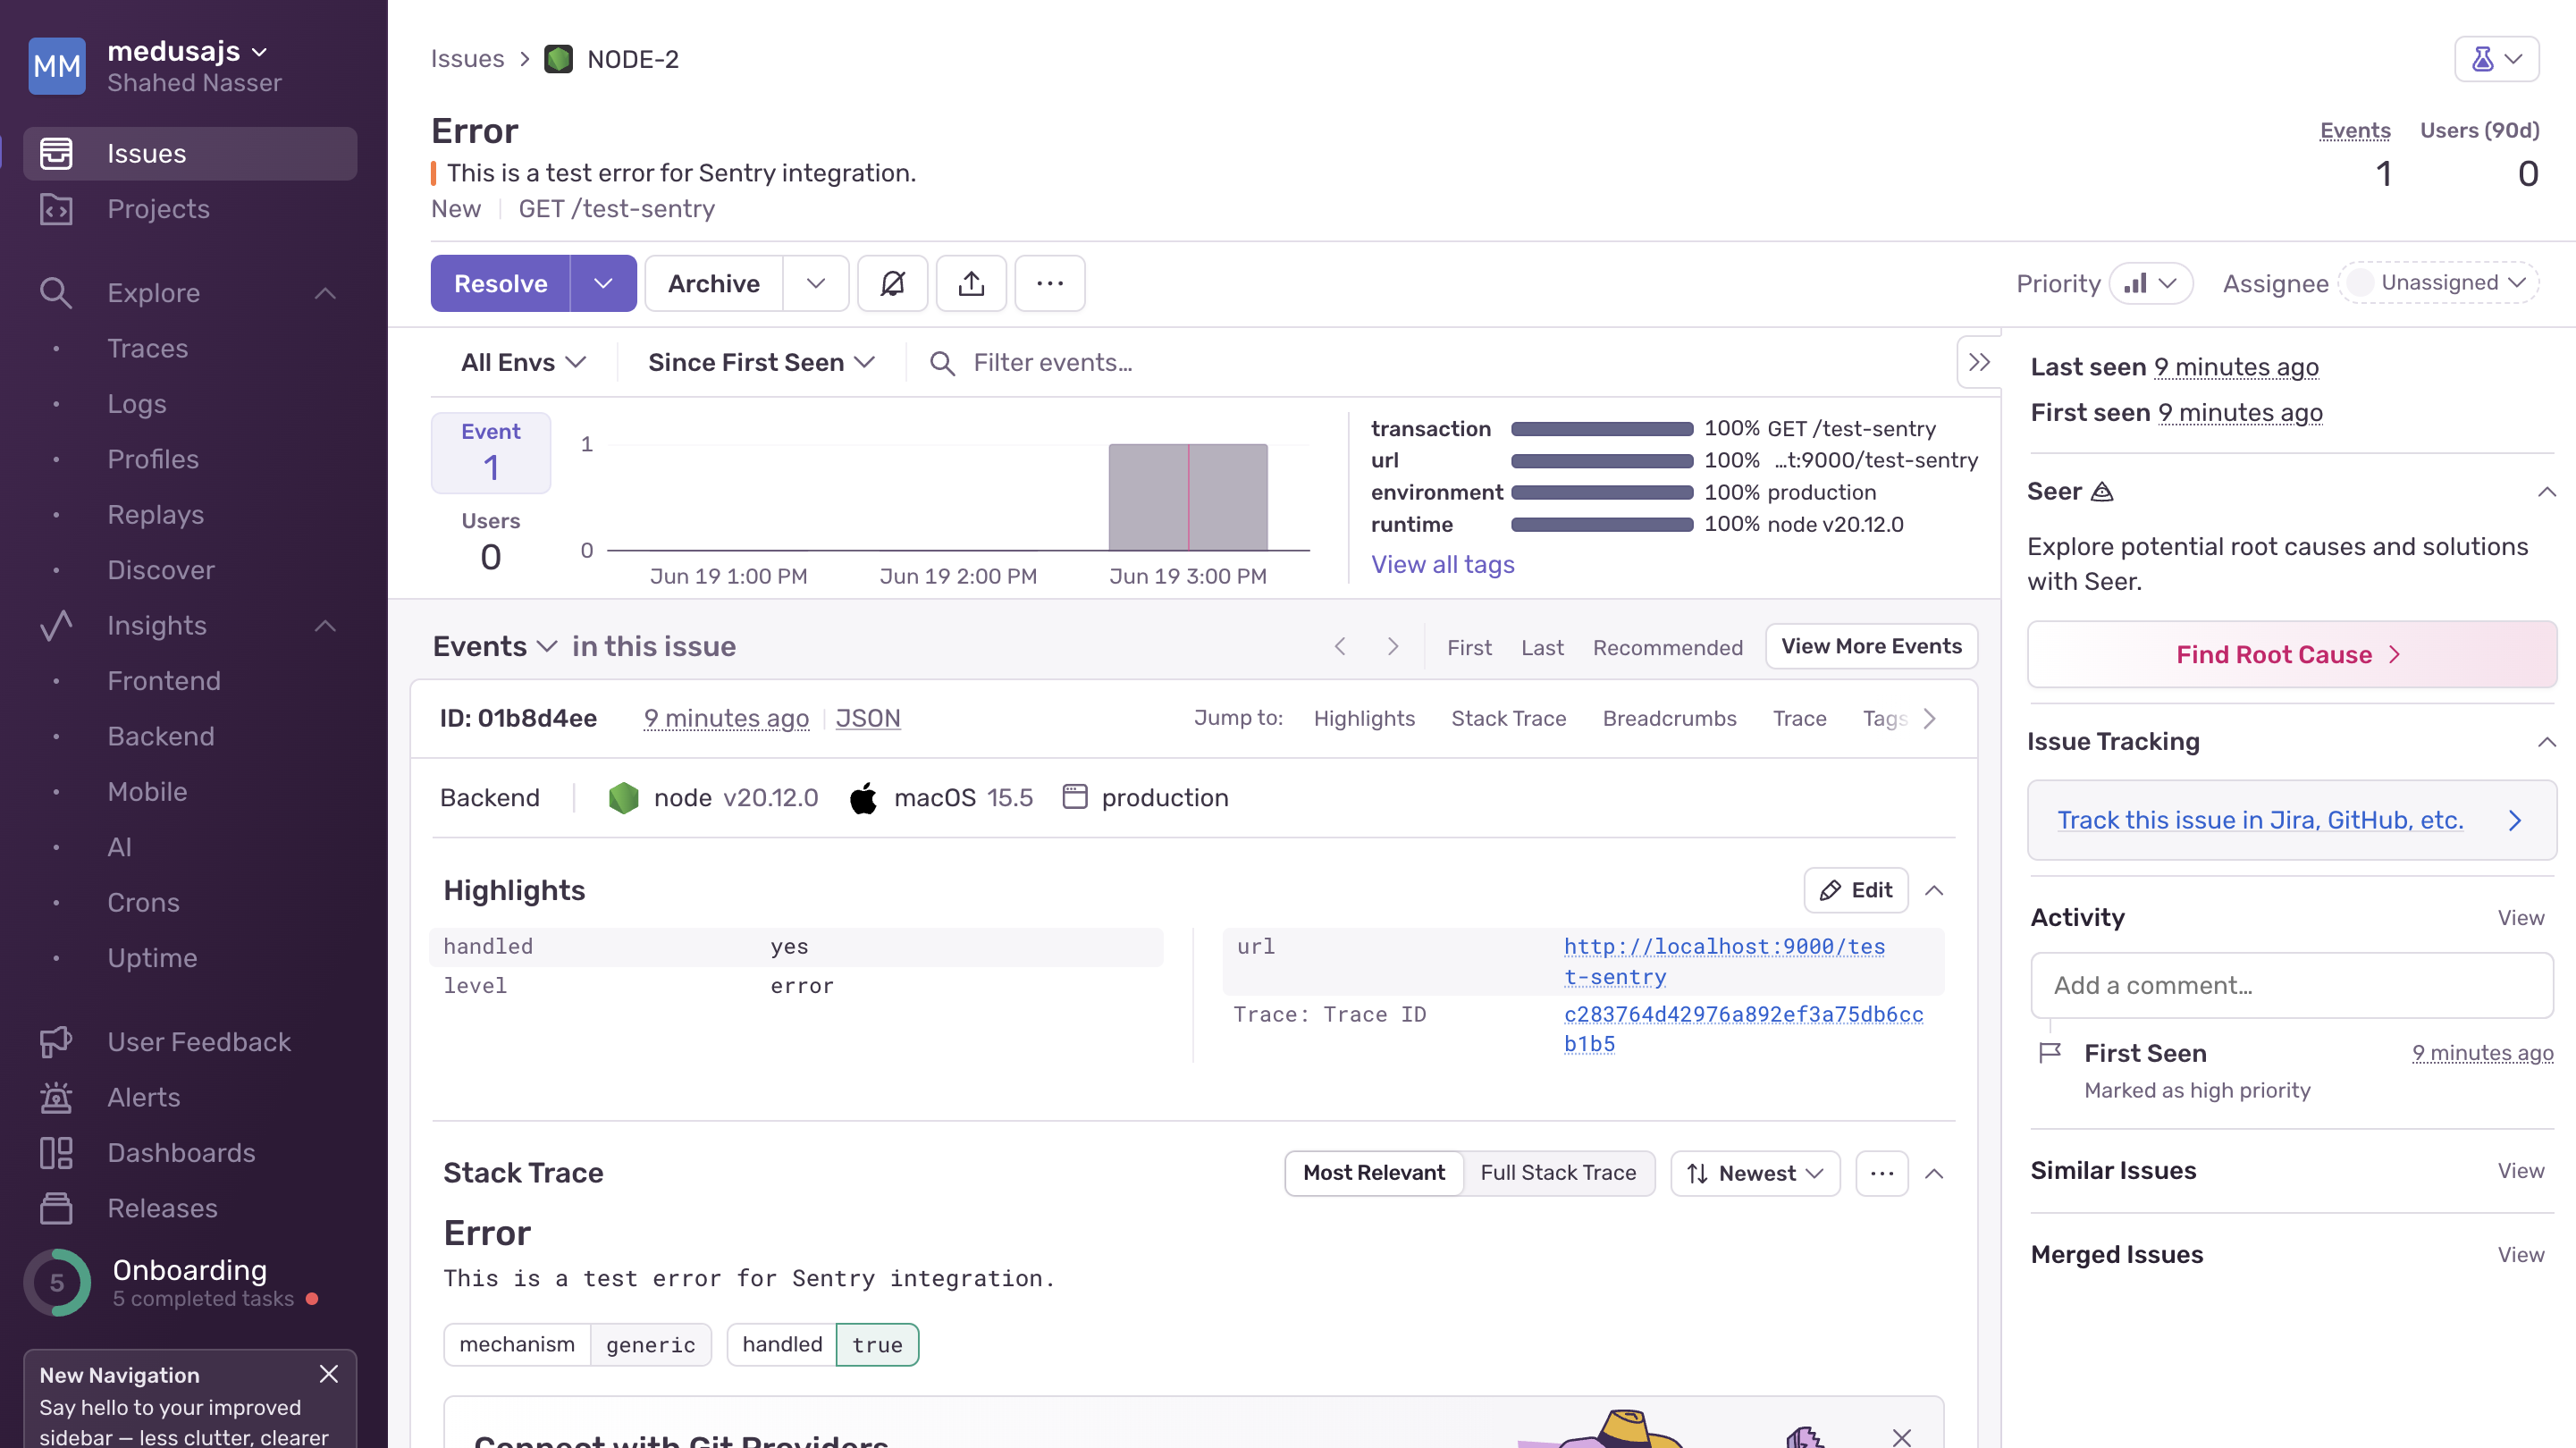
You'll find in the tracing page the thrown error highlighted in red, indicating that it was captured by Sentry.
|
|
|
|
|
|
|
|
If you click on the error, you can view more details about it, such as its stack trace, how many times it occurred, its breadcrumbs, and more.
|
|
|
|
|
|
|
|
By capturing HTTP request errors in Sentry, you can now monitor and track errors in your Medusa application effectively. You can also set up alerts in Sentry to get notified about critical issues and handle them promptly.
|
|
|
|
---
|
|
|
|
## Next Steps
|
|
|
|
You've now integrated Sentry with your Medusa application. You can continue using Sentry to monitor your application's performance and track errors.
|
|
|
|
You can also expand on your Sentry integration by enabling more features, such as:
|
|
|
|
- [Alerts](https://docs.sentry.io/product/alerts/) to get notified about critical issues in your application. You can receive alerts via email, Slack, or other channels.
|
|
- [Profiling](https://docs.sentry.io/platforms/javascript/guides/nextjs/profiling/node/) to analyze your application's performance and identify bottlenecks.
|
|
- [User feedback](https://docs.sentry.io/product/user-feedback/) to collect feedback in your frontend from users about their experience with your application.
|
|
|
|
If you're new to Medusa, check out the [main documentation](!docs!/learn), where you'll get a more in-depth understanding of all the concepts you've used in this guide and more.
|
|
|
|
To learn more about the commerce features that Medusa provides, check out Medusa's [Commerce Modules](../../../commerce-modules/page.mdx).
|
|
|
|
### Troubleshooting
|
|
|
|
If you encounter issues during your development, check out the [troubleshooting guides](../../../troubleshooting/page.mdx).
|
|
|
|
### Getting Help
|
|
|
|
If you encounter issues not covered in the troubleshooting guides:
|
|
|
|
1. Visit the [Medusa GitHub repository](https://github.com/medusajs/medusa) to report issues or ask questions.
|
|
2. Join the [Medusa Discord community](https://discord.gg/medusajs) for real-time support from community members.
|
|
3. Contact the [sales team](https://medusajs.com/contact/) to get help from the Medusa team.
|