369 lines
17 KiB
Plaintext
369 lines
17 KiB
Plaintext
import { Table, InlineIcon } from "docs-ui"
|
|
import { EllipsisHorizontal } from "@medusajs/icons"
|
|
|
|
export const metadata = {
|
|
title: `Deployments`,
|
|
}
|
|
|
|
# {metadata.title}
|
|
|
|
In this guide, you'll learn about deployments in Cloud, how they're created, and how you can troubleshoot them.
|
|
|
|
## Deployments Overview
|
|
|
|
Each [environment](../environments/page.mdx) has at least one deployment, which is publicly accessible at the [environment's URL](#find-environments-url).
|
|
|
|
A deployment is created from the latest source code of an [environment](../environments/page.mdx)'s branch. An environment can have only one live deployment at a time.
|
|
|
|
The latest deployment of an environment is the live version of that environment, unless you [redeploy a previous deployment](#redeploy-a-deployment).
|
|
|
|
---
|
|
|
|
## How are Deployments Created?
|
|
|
|
For long-lived environments, Medusa creates a new deployment every time you push a new commit to the environment's branch. For example, if your Production environment is connected to the `main` branch, Medusa will create a new Production deployment every time you push a new commit to the `main` branch.
|
|
|
|
For short-lived preview environments, Medusa creates a new environment and deployment when you open a pull request. Medusa will redeploy the preview environment every time you push a new commit to the pull request branch.
|
|
|
|
---
|
|
|
|
## Build Process for Deployments
|
|
|
|
Before deploying your application on Cloud, Medusa runs the `build` script defined in your project's `package.json` file, which must run the `medusa build` command, among other build steps you may have.
|
|
|
|
For example, your `build` script may look like this:
|
|
|
|
```json title="package.json"
|
|
{
|
|
"scripts": {
|
|
"build": "medusa build && npm run other-build-steps"
|
|
}
|
|
}
|
|
```
|
|
|
|
<Note>
|
|
|
|
You can replace `npm run other-build-steps` with the appropriate command for your package manager, such as `yarn other-build-steps`.
|
|
|
|
</Note>
|
|
|
|
### What Gets Deployed?
|
|
|
|
Medusa deploys the contents of the `.medusa/server` directory created by the [build process](!docs!/learn/build). It includes the compiled JavaScript files in your project, the production build of the admin dashboard, and other necessary files to run your Medusa application in production.
|
|
|
|
<Note>
|
|
|
|
Learn more about the `.medusa/server` directory in the [Build guide](!docs!/learn/build#output-directory-structure).
|
|
|
|
</Note>
|
|
|
|
So, if you have custom assets like JSON files that your application needs at runtime, make sure to copy them to the `.medusa/server` directory after the `medusa build` command in your `build` script.
|
|
|
|
For example, if your application needs a `src/data/custom.json` file at runtime, you can add a script that copies it to `.medusa/server/src/data/custom.json` after the build process is complete.
|
|
|
|
You can also customize the Medusa Admin build configurations using the [admin.vite](!docs!/learn/configurations/medusa-config#adminvite) option in your `medusa-config.ts` file.
|
|
|
|
<Note type="warning">
|
|
|
|
Do not expose sensitive files in your deployments, especially in the `.medusa/server/public` directory, as they will be publicly accessible. Sensitive files include those containing secret API keys, database credentials, or any other confidential information.
|
|
|
|
</Note>
|
|
|
|
---
|
|
|
|
## Find Project Deployments
|
|
|
|
You can find the deployments for a project in its dashboard.
|
|
|
|
To find the deployments for a project:
|
|
|
|
1. Make sure you're viewing the [correct organization's dashboard in Cloud](../organizations/page.mdx#switch-organization).
|
|
2. Click on the project you want to view its deployments.
|
|
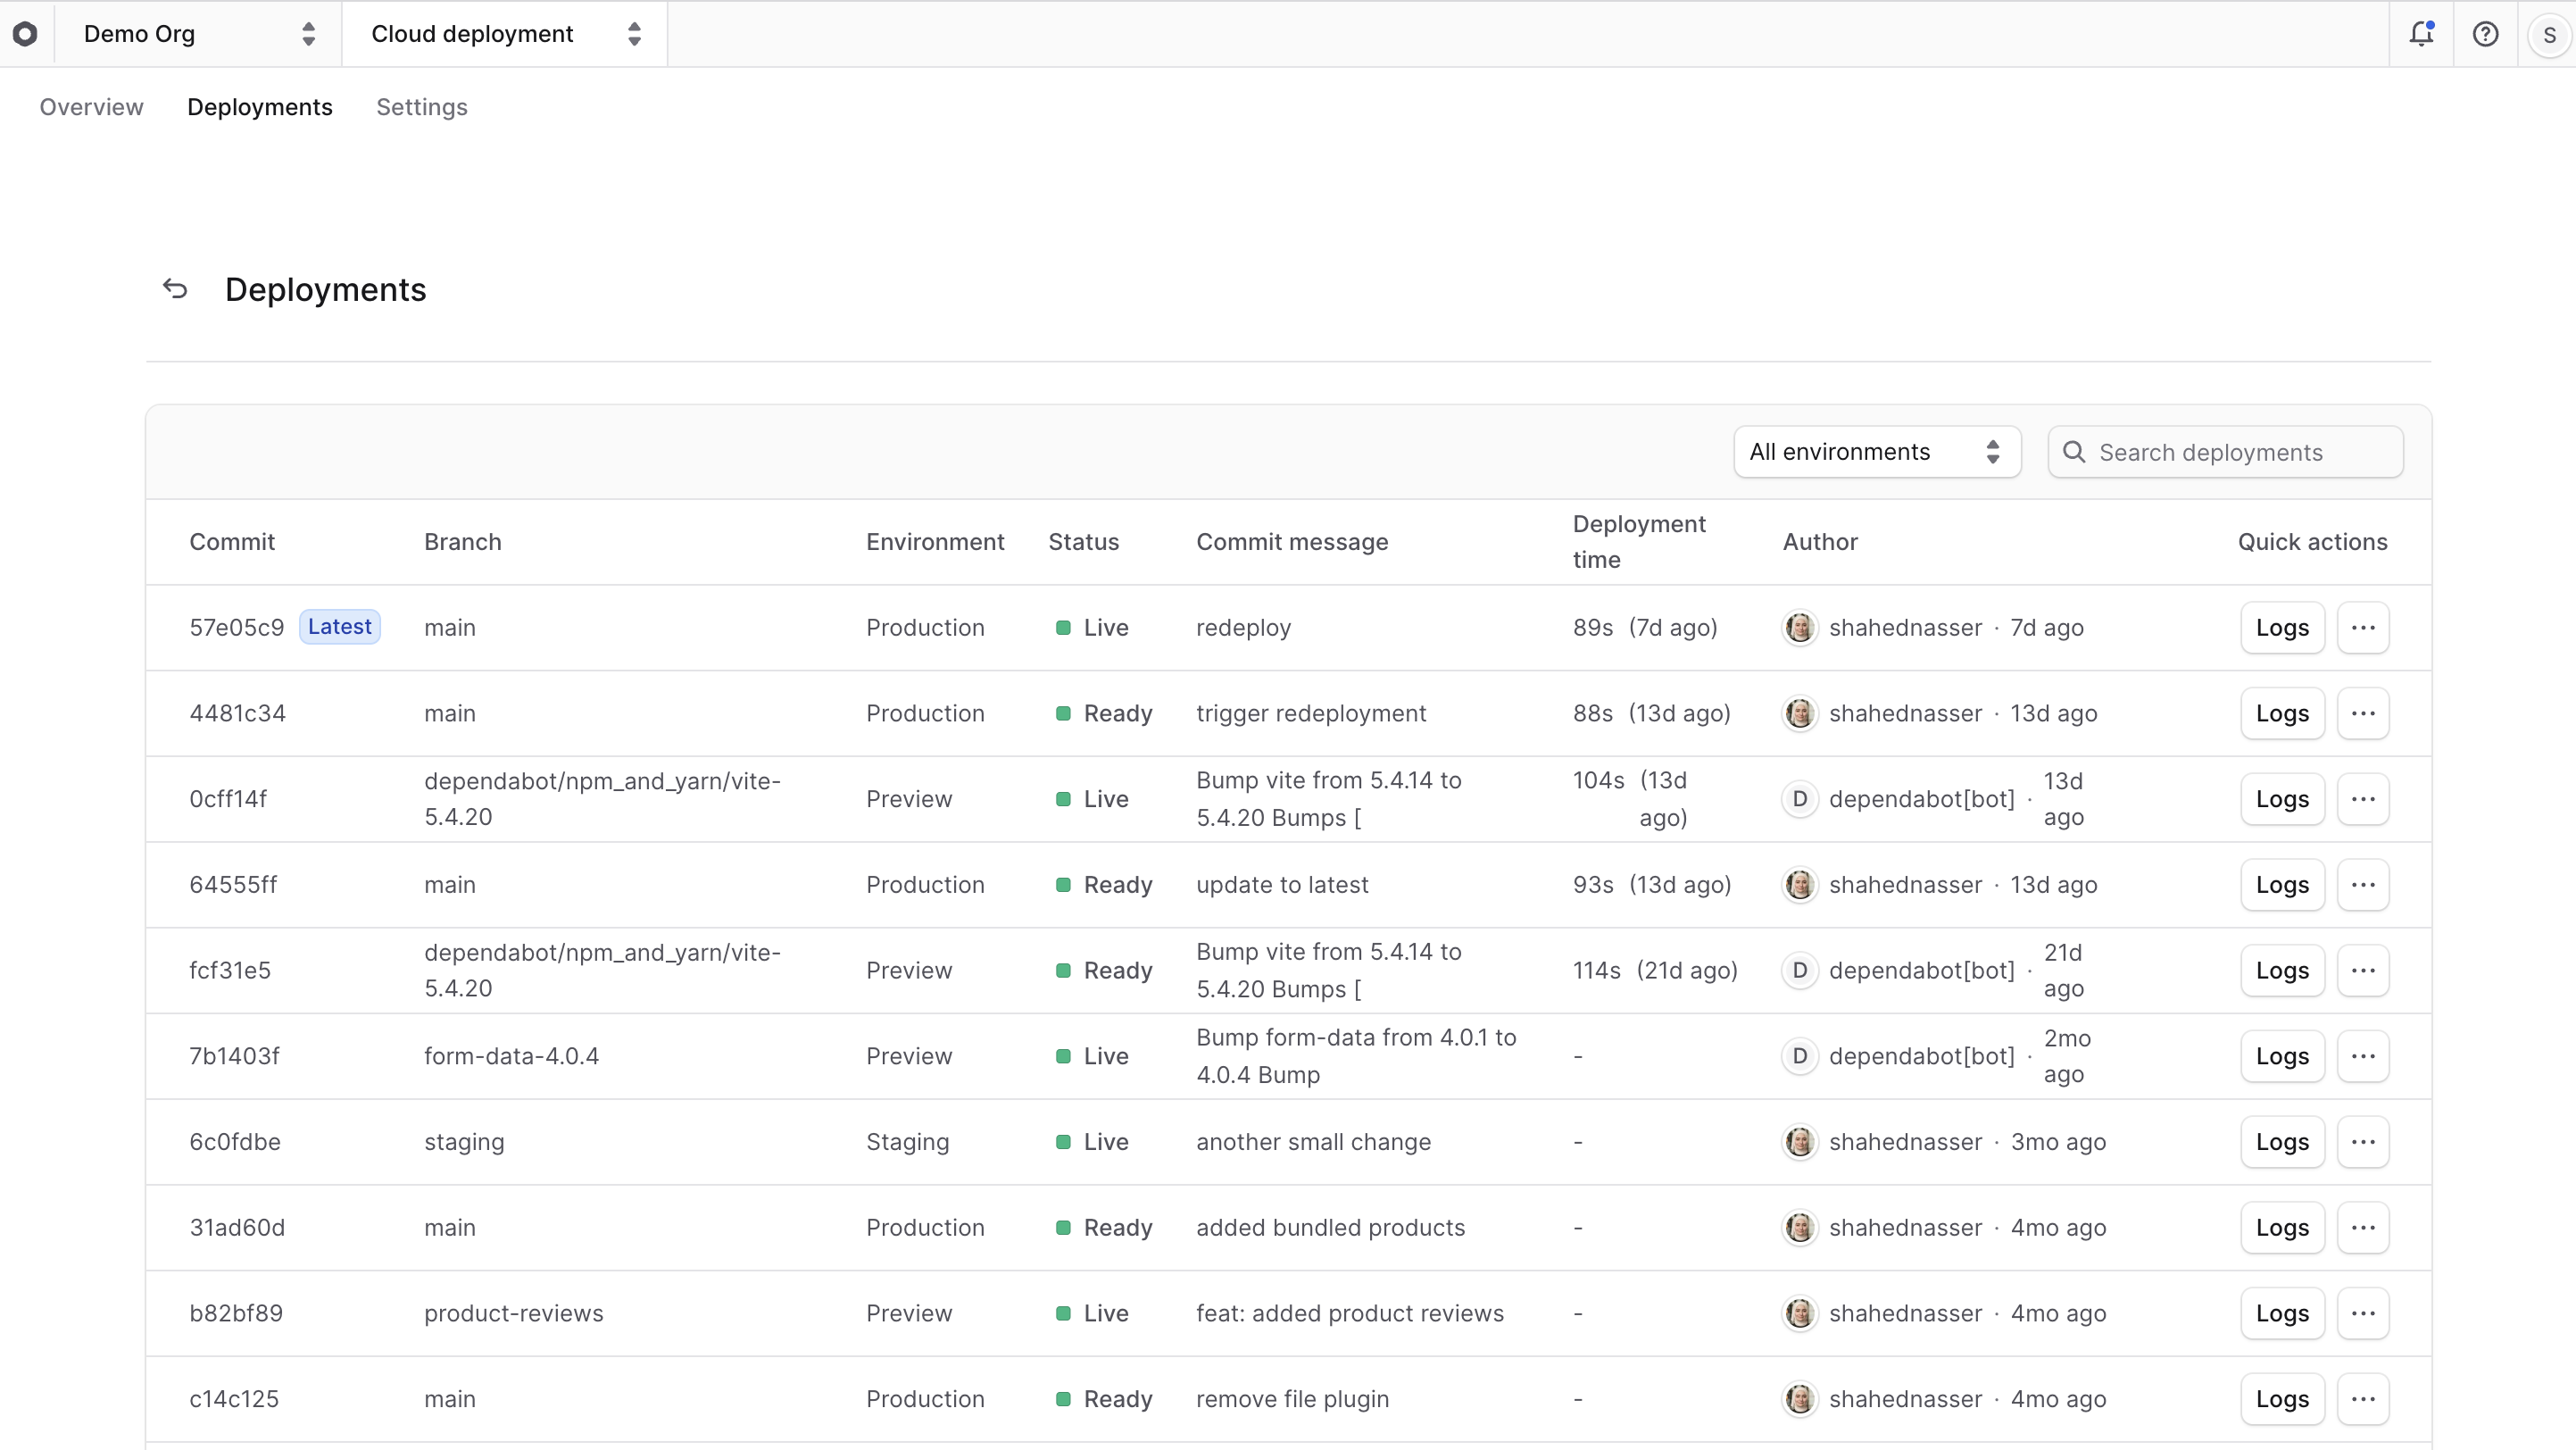
3. Click on the "Deployments" tab in the project's dashboard.
|
|
|
|
You'll find all deployments for the project's environments in the "Deployments" tab, sorted in descending order. For each deployment, you can see its branch, environment, status, and more.
|
|
|
|
|
|
|
|
---
|
|
|
|
|
|
## Find Environment Deployments
|
|
|
|
You can find the deployments for an environment in the project and environment dashboards.
|
|
|
|
For example, to find the deployments for the Production environment:
|
|
|
|
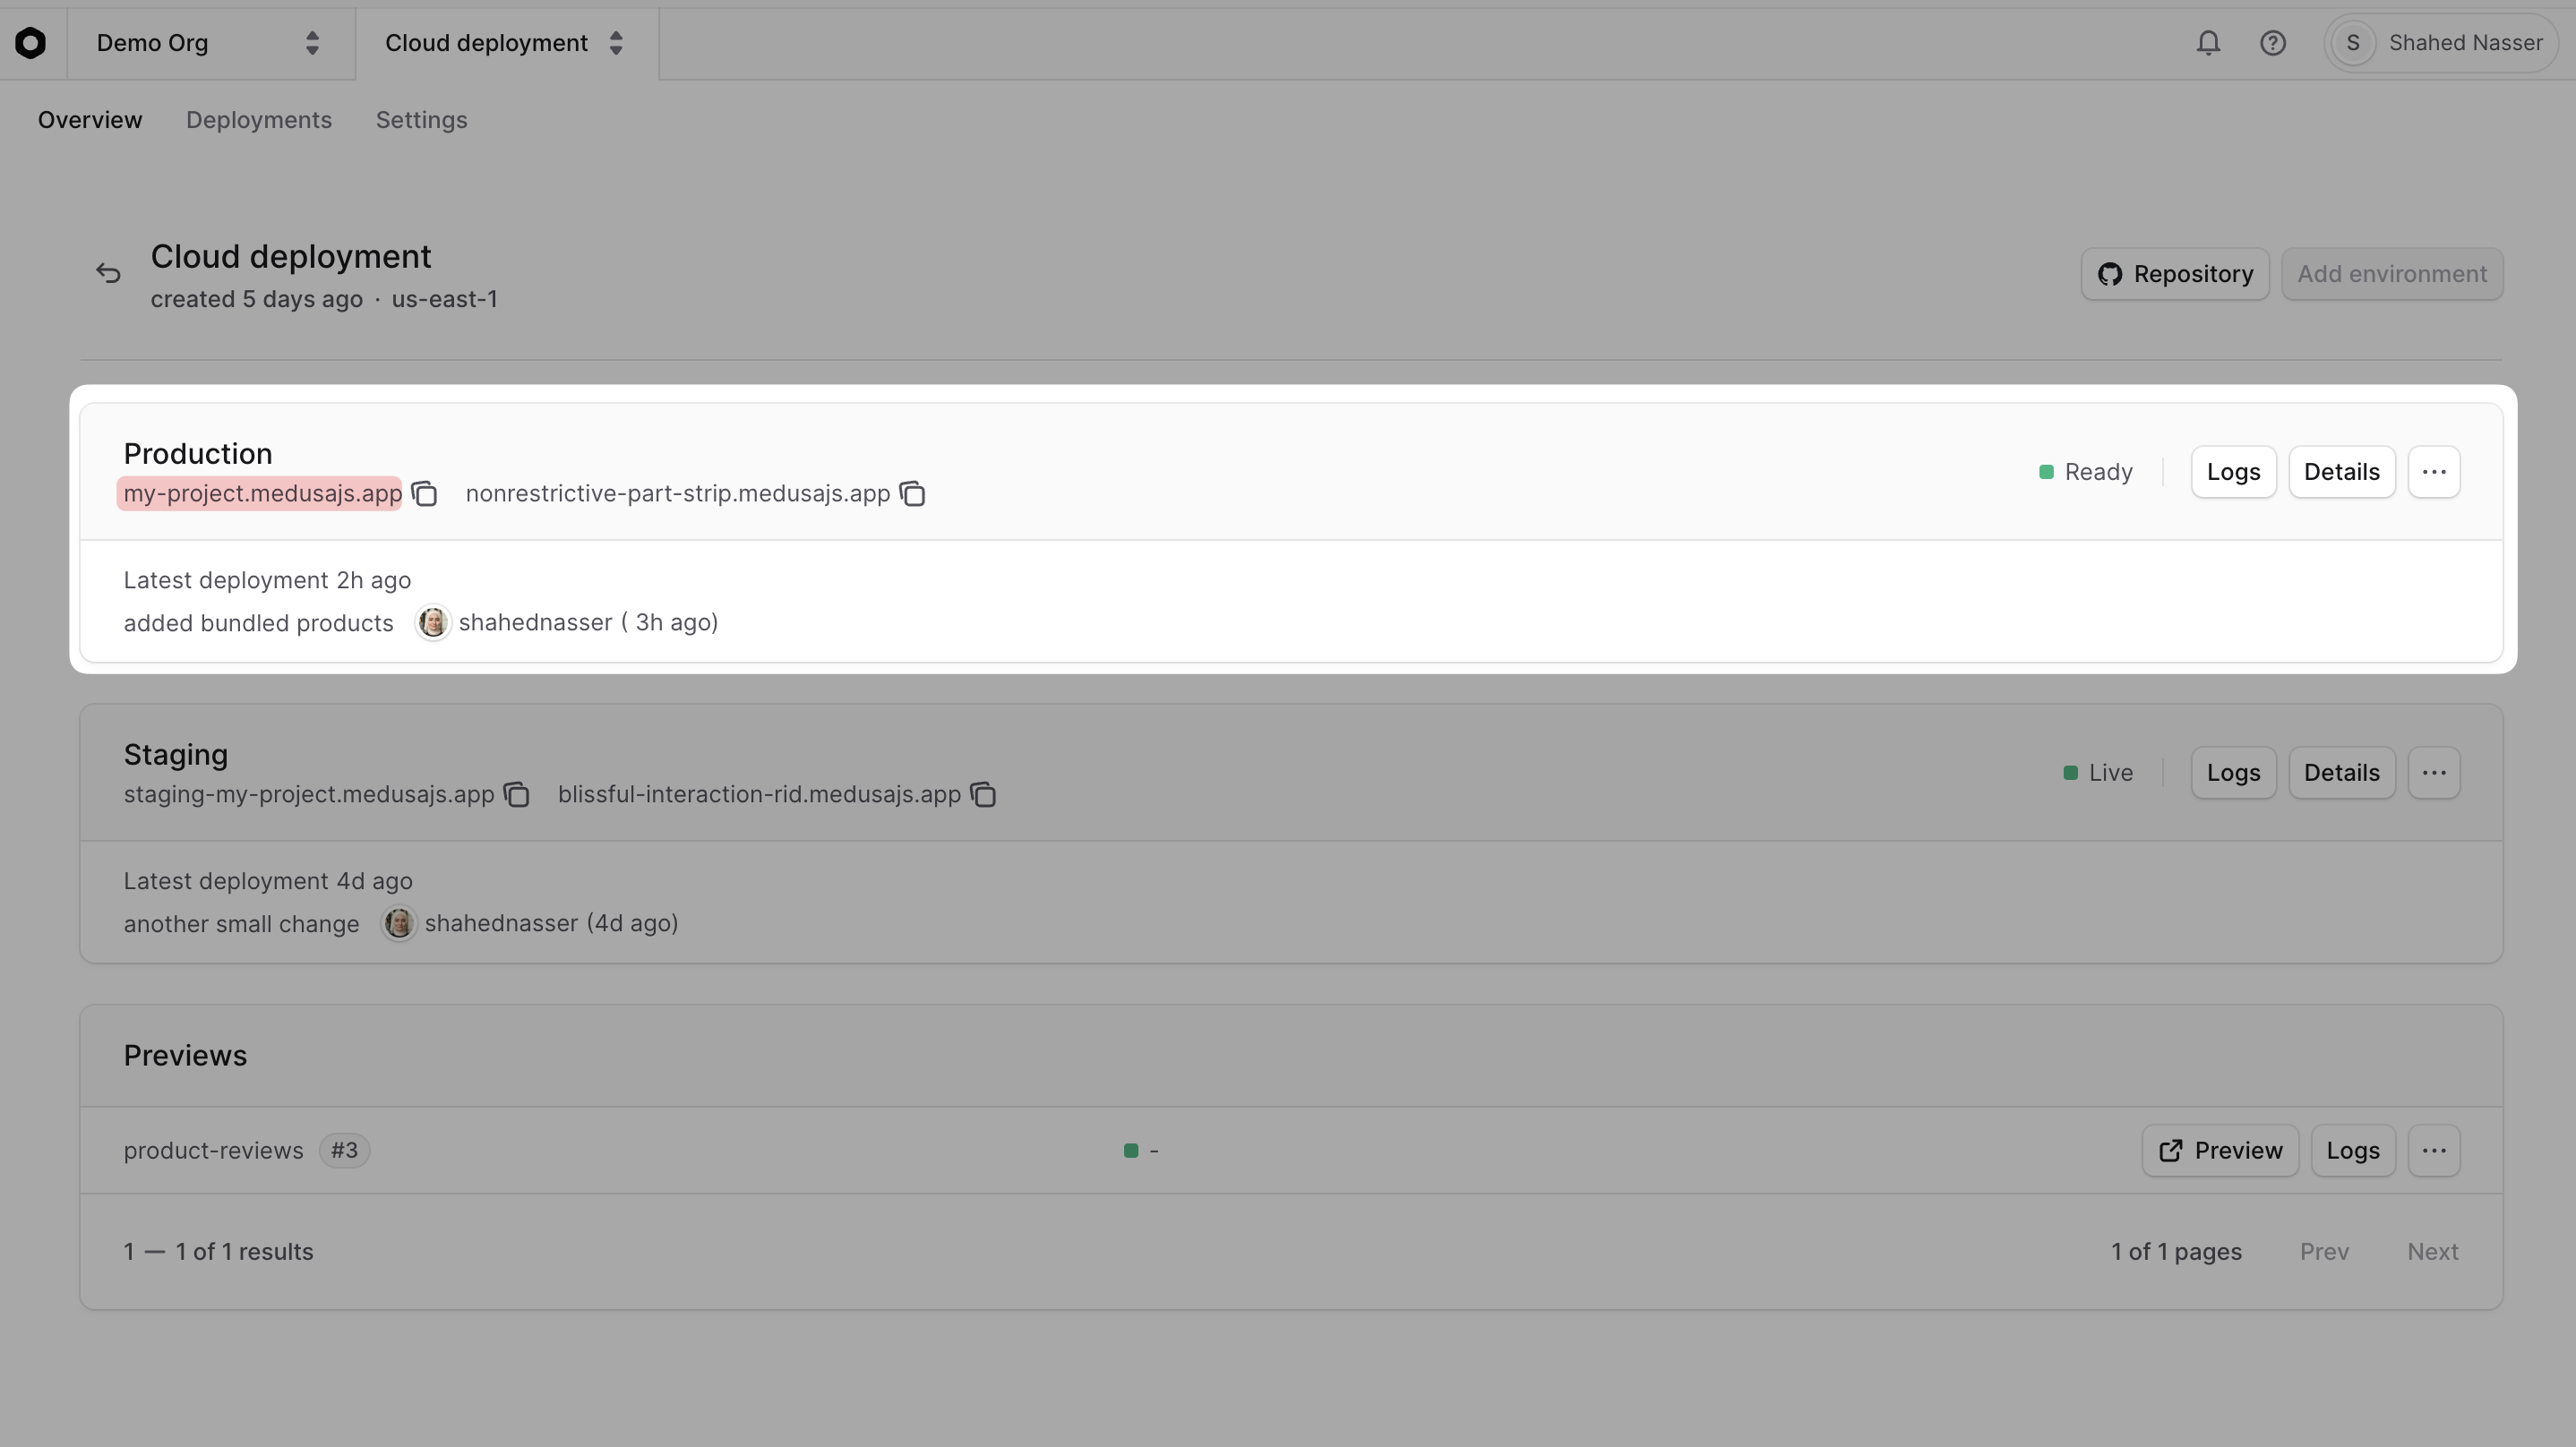
1. [Go to its project's dashboard](../projects/page.mdx#open-project-dashboard).
|
|
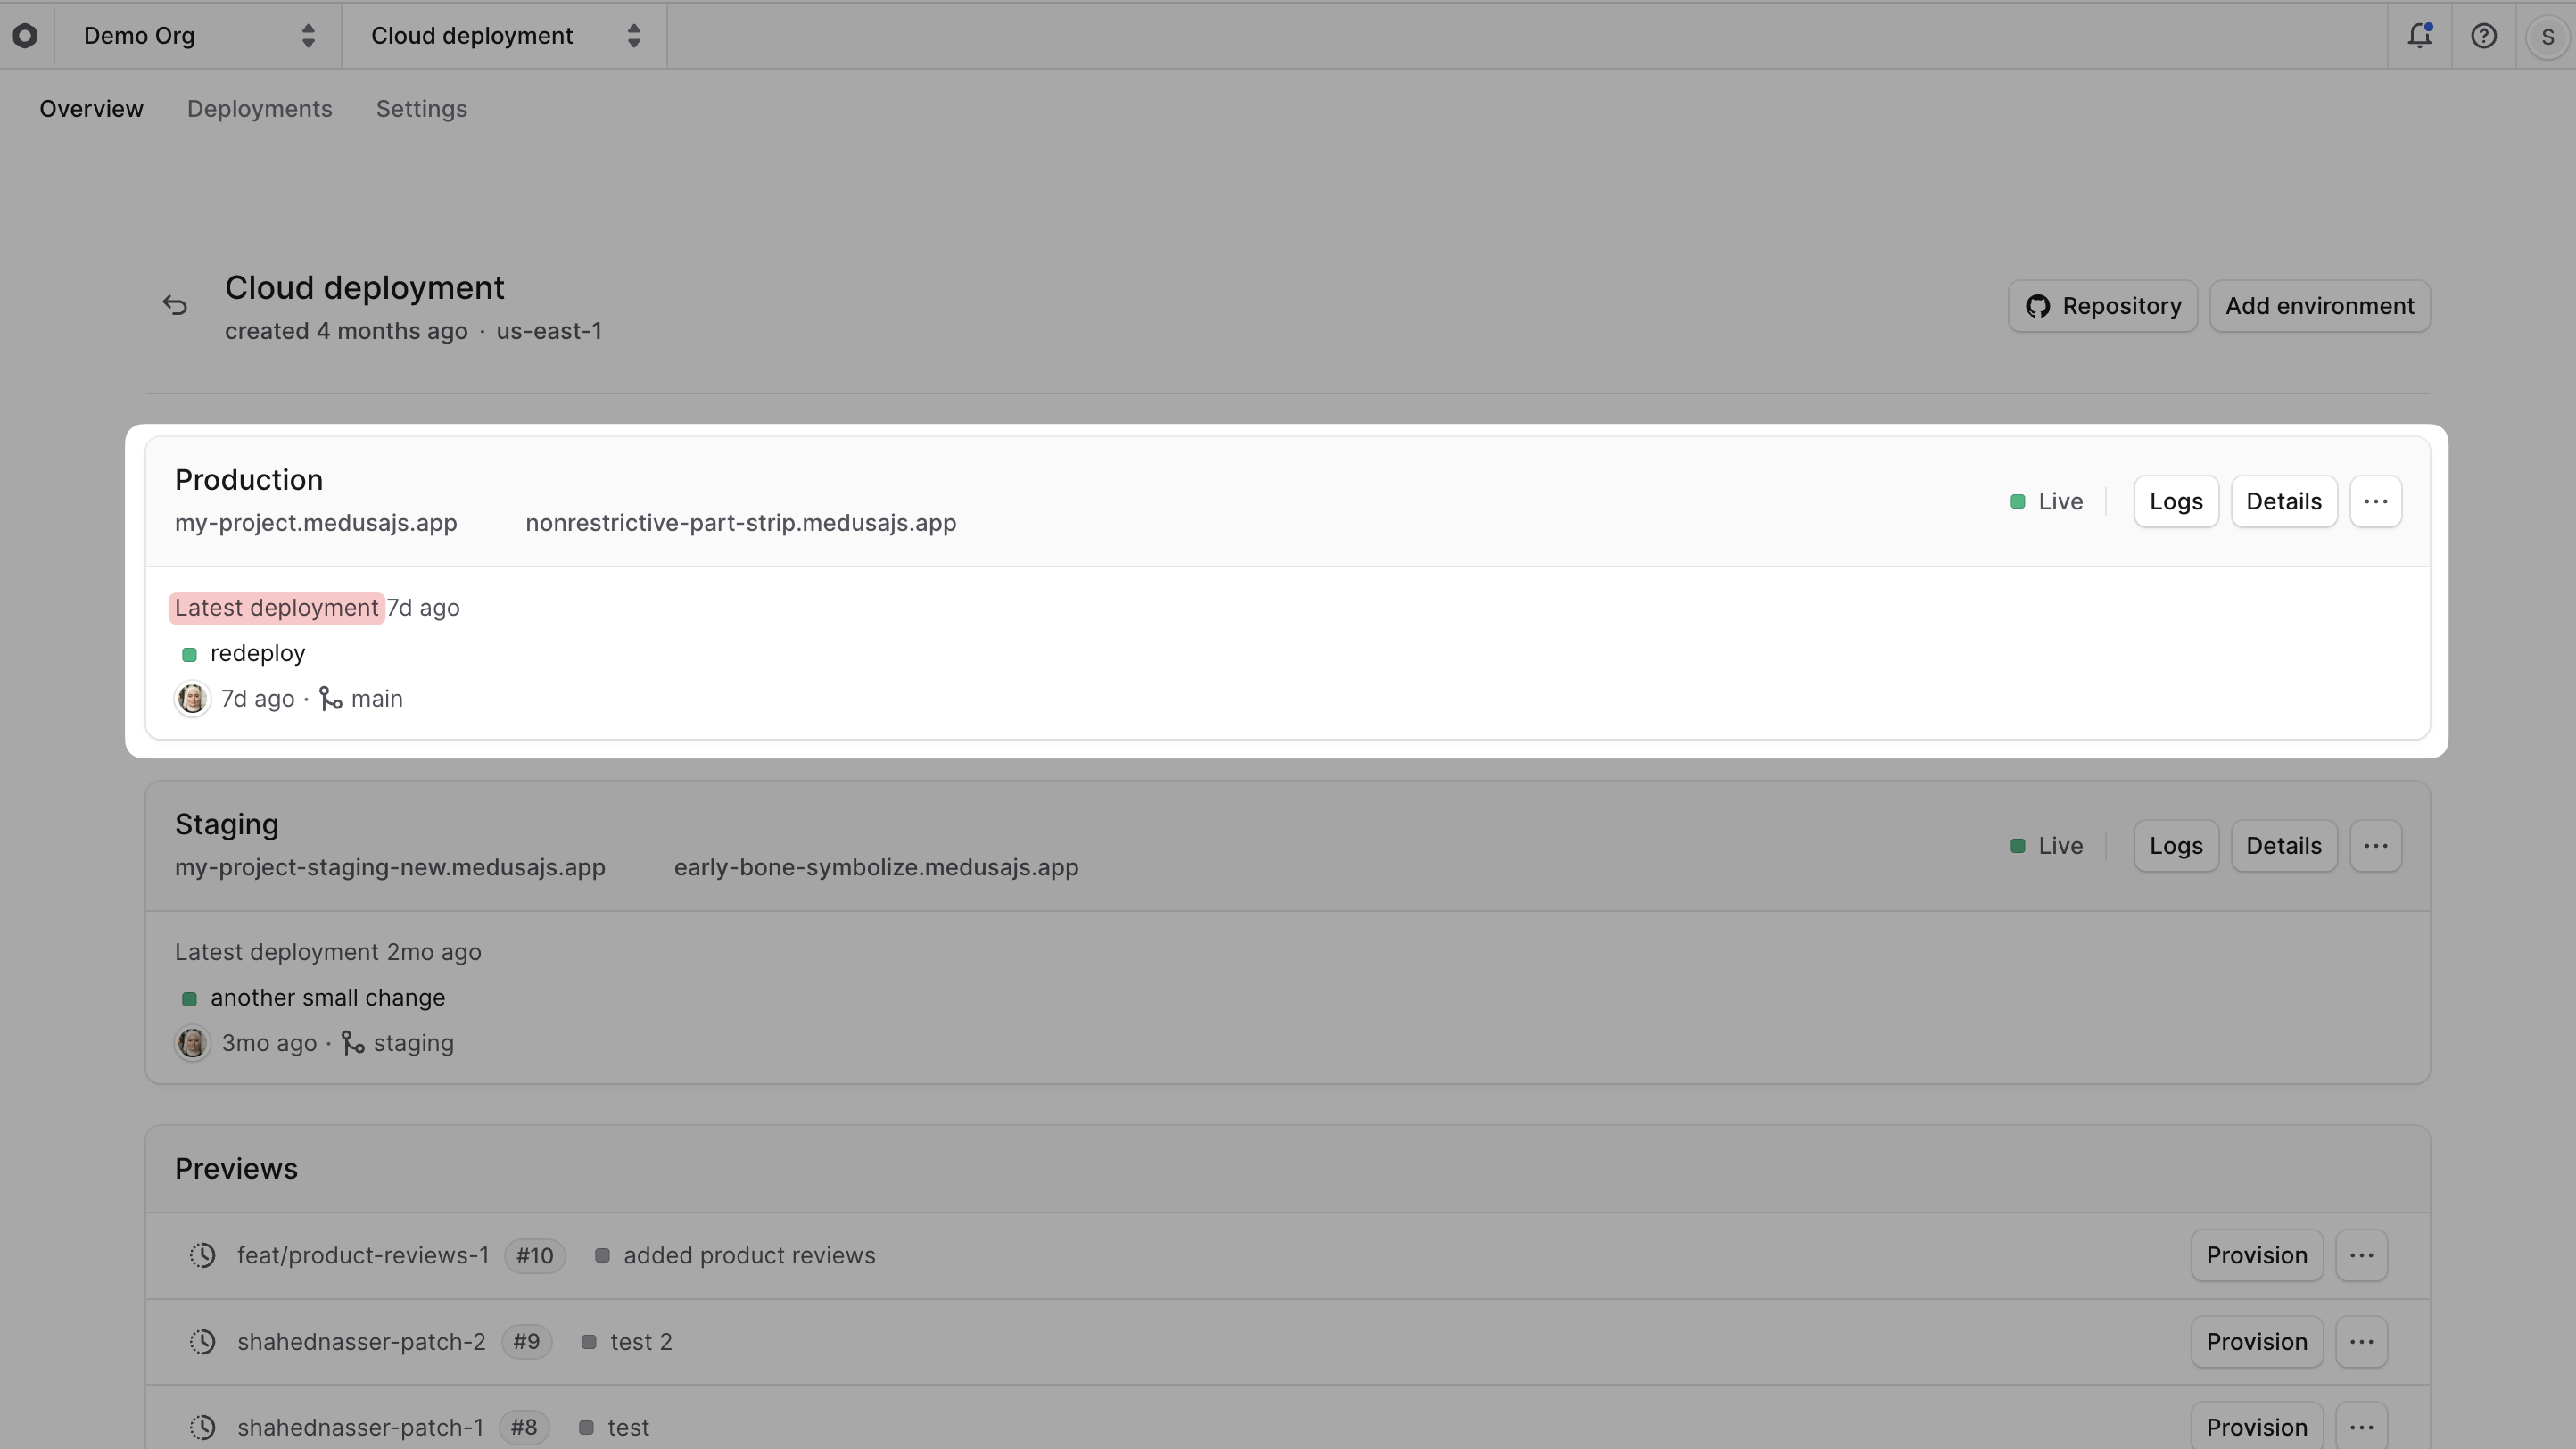
2. You can go to the latest Production deployment's details by clicking the "Latest Deployment" link in the Production environment card.
|
|
|
|
|
|
|
|
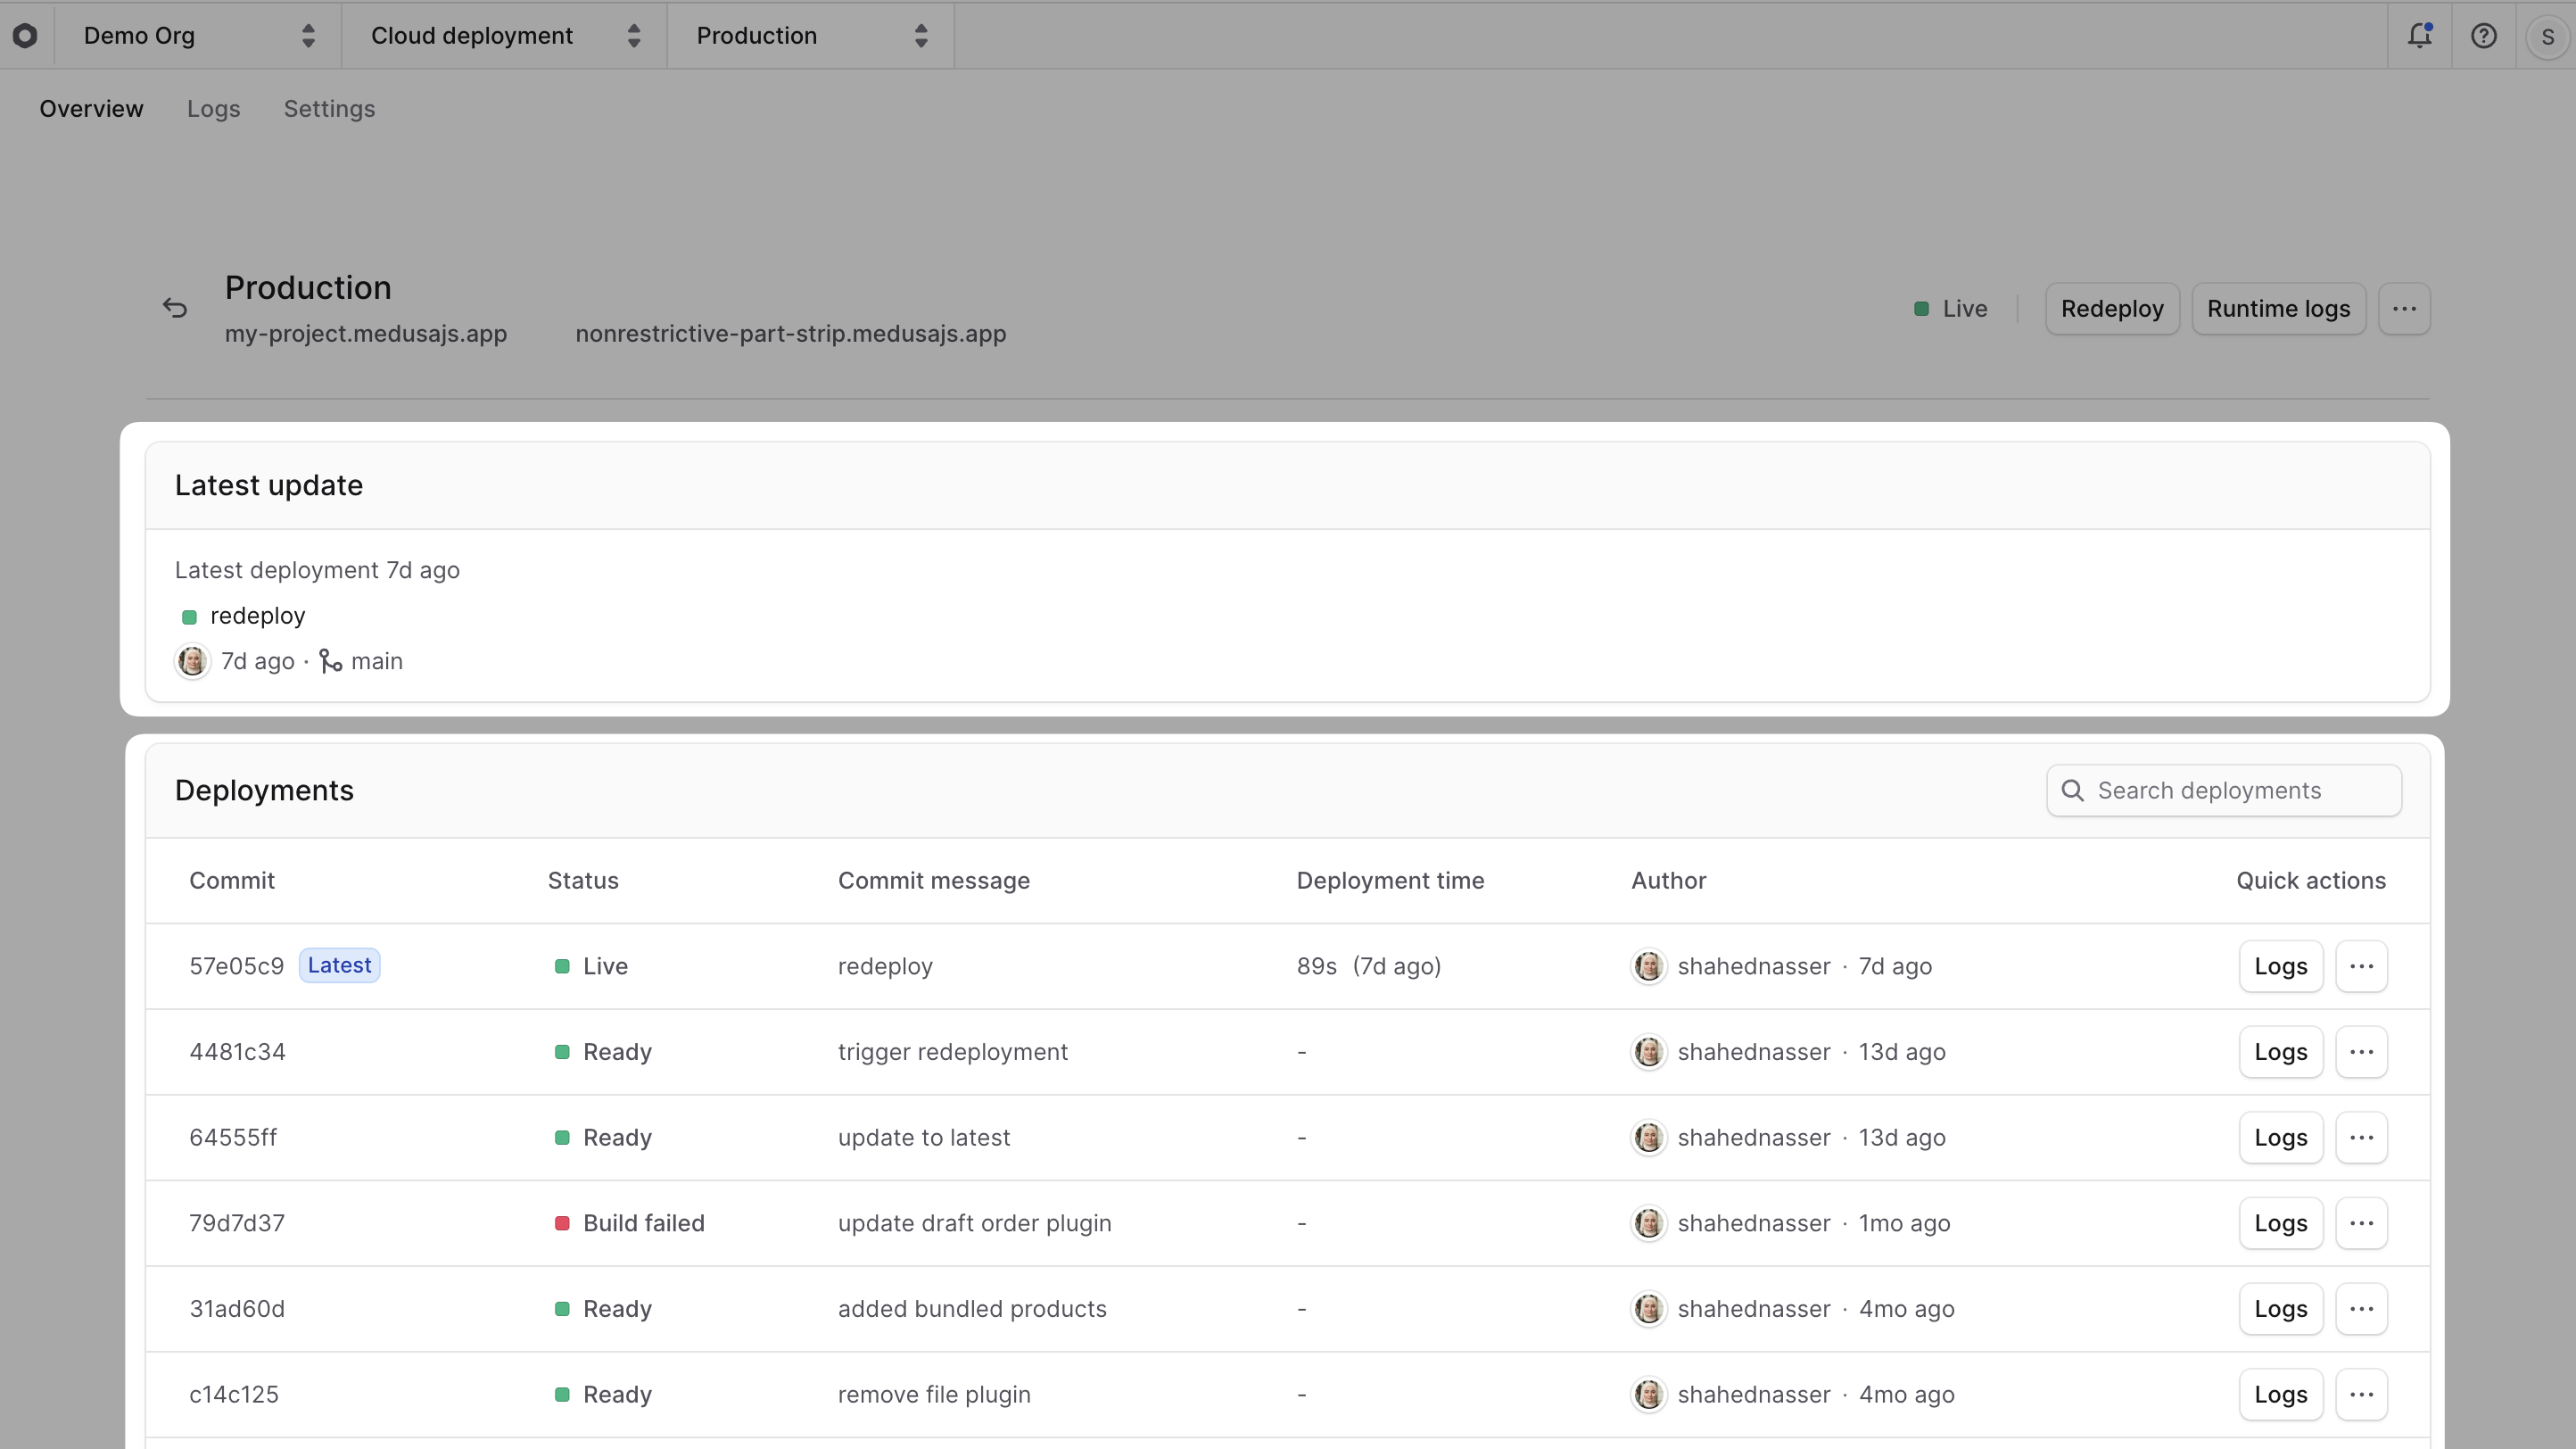
3. To find a list of all deployments, click on the "Production" environment card to open the environment's dashboard.
|
|
- The "Latest update" card shows details about the latest deployment.
|
|
- The "Deployments" card shows the list of all previous deployments.
|
|
|
|
|
|
|
|
The last step applies to all environments in your project, including custom environments (like Staging) and preview environments.
|
|
|
|
---
|
|
|
|
## Find Deployment Details
|
|
|
|
You'll often need to check a deployment's details, such as its status, commit information, and logs.
|
|
|
|
To view a deployment's details:
|
|
|
|
1. [Go to its project's dashboard](../projects/page.mdx#open-project-dashboard).
|
|
2. If you're looking for the latest deployment:
|
|
- Click the "Latest Deployment" link in its environment's card.
|
|
3. If you're looking for an older deployment:
|
|
- Click on its environment's card to open its dashboard.
|
|
- In the "Deployments" card, click on the deployment you want to view.
|
|
|
|
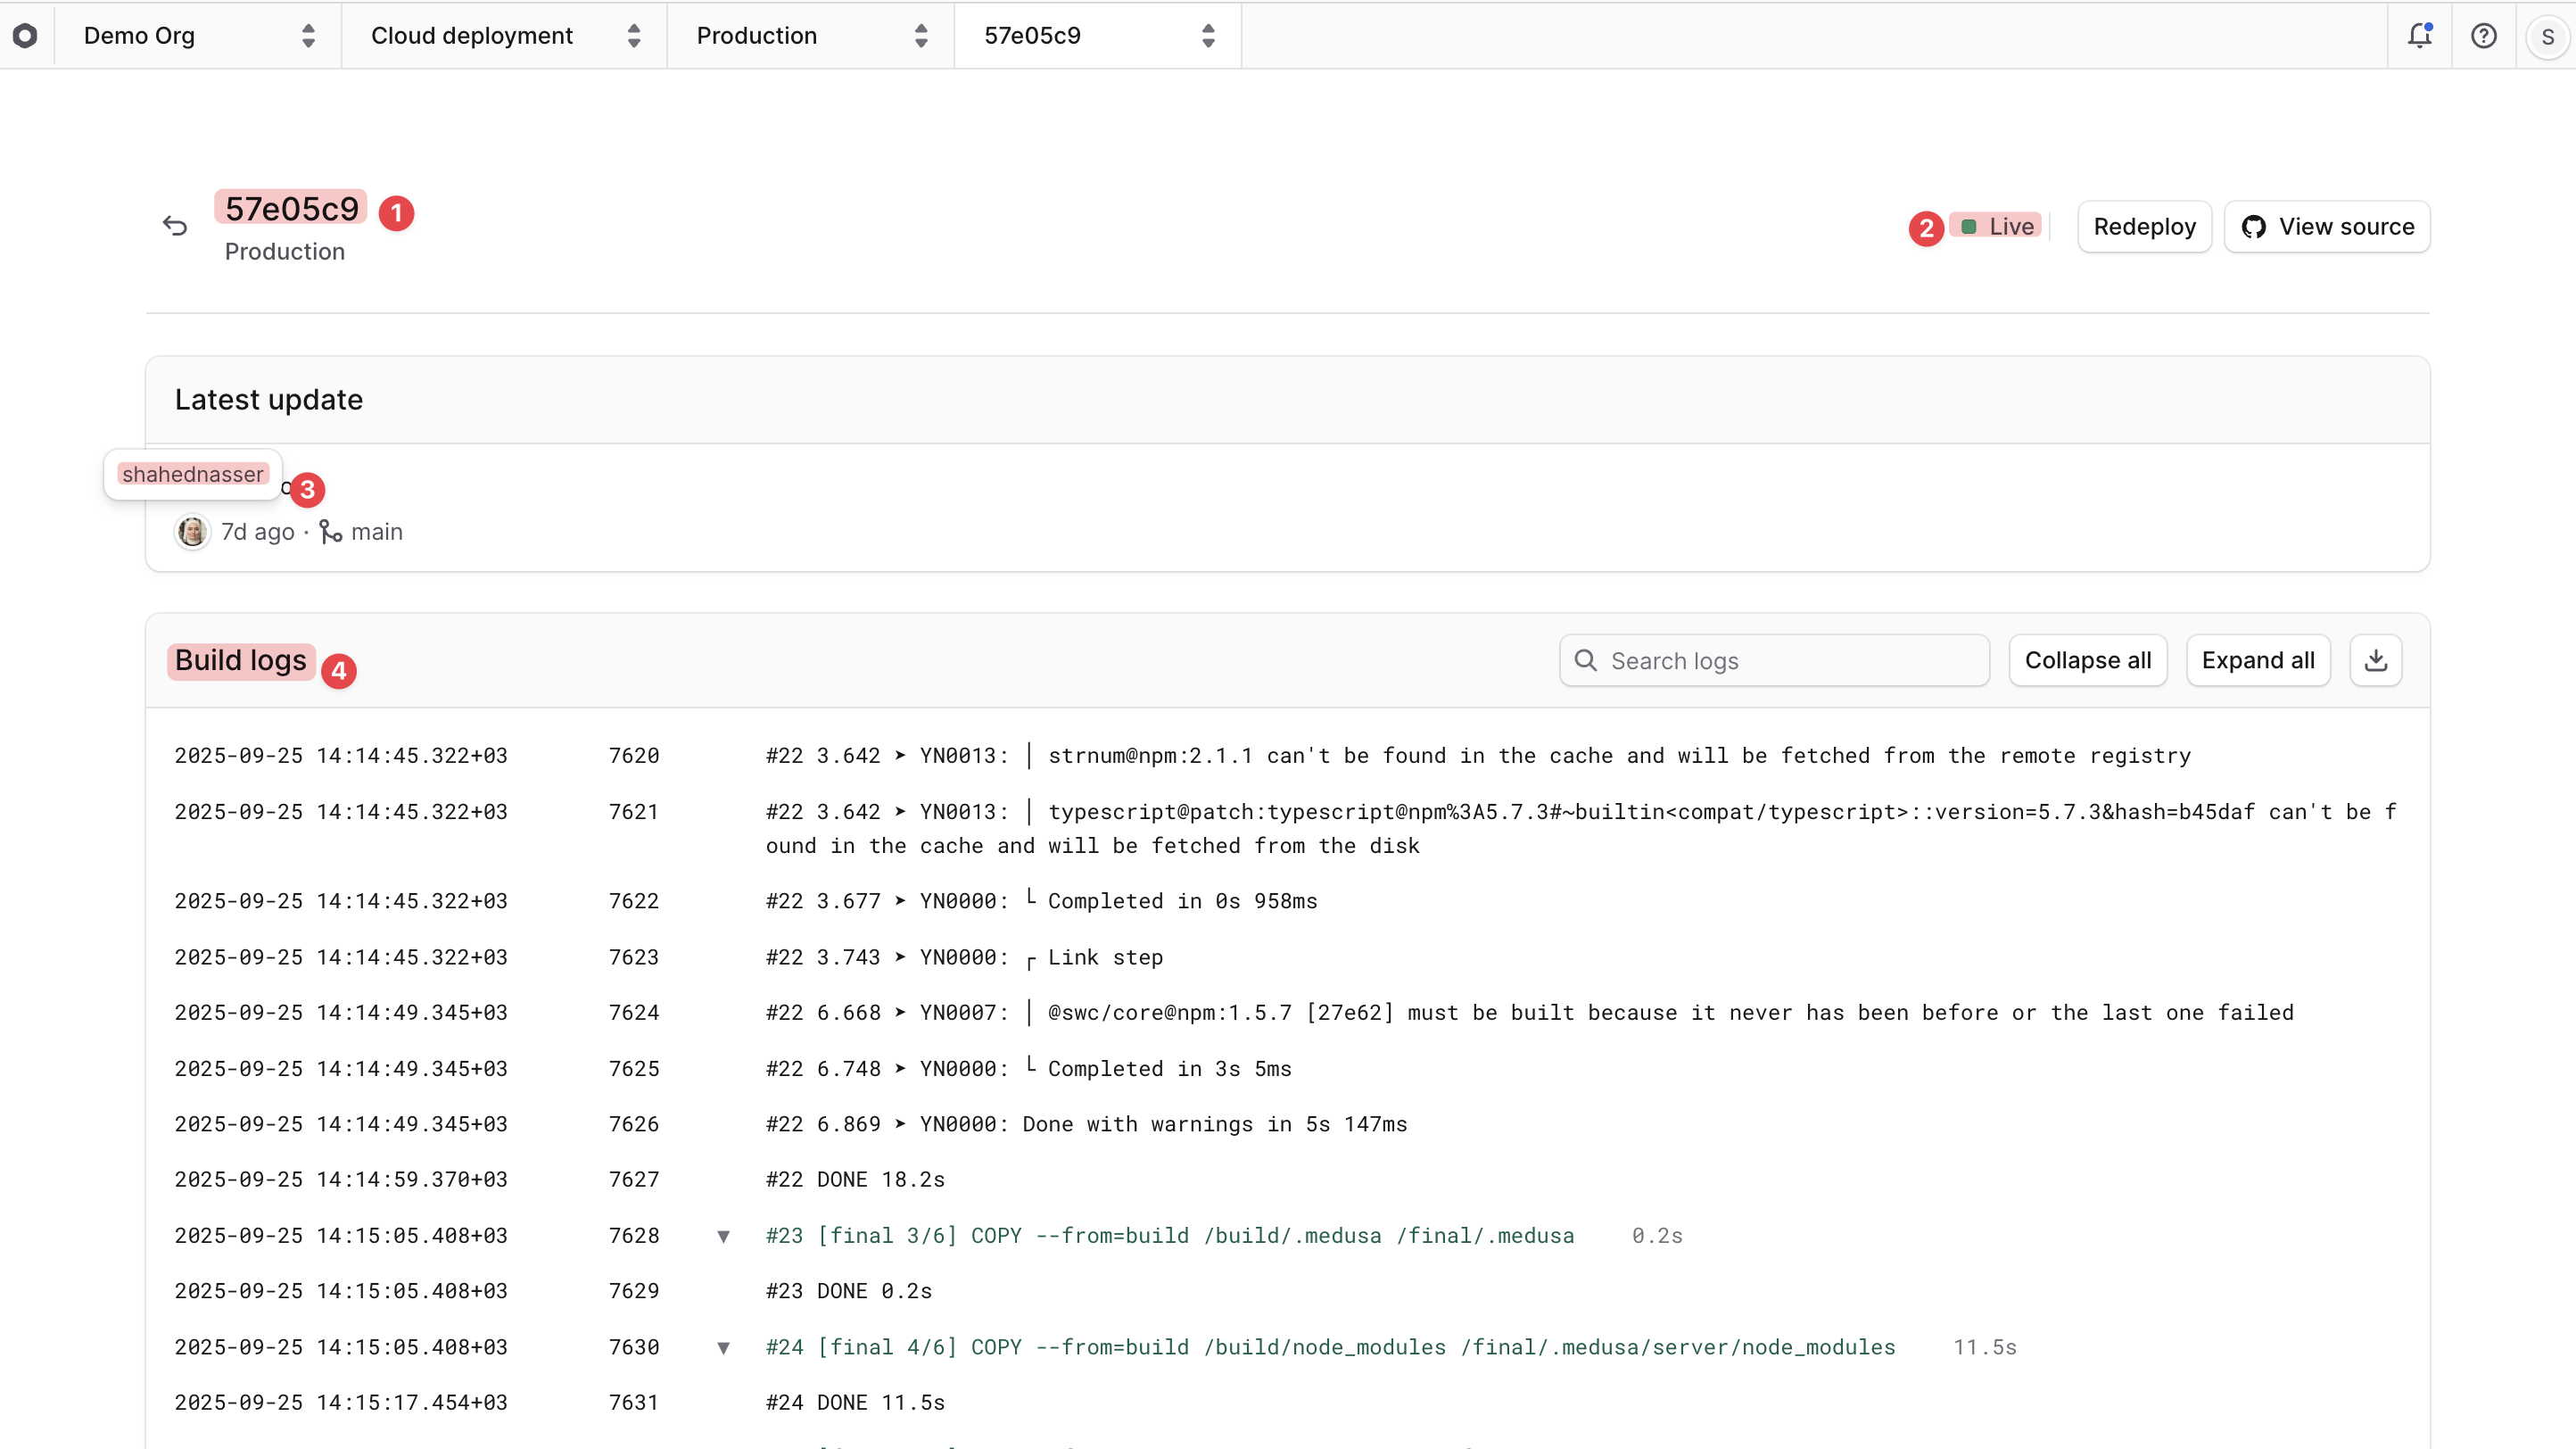
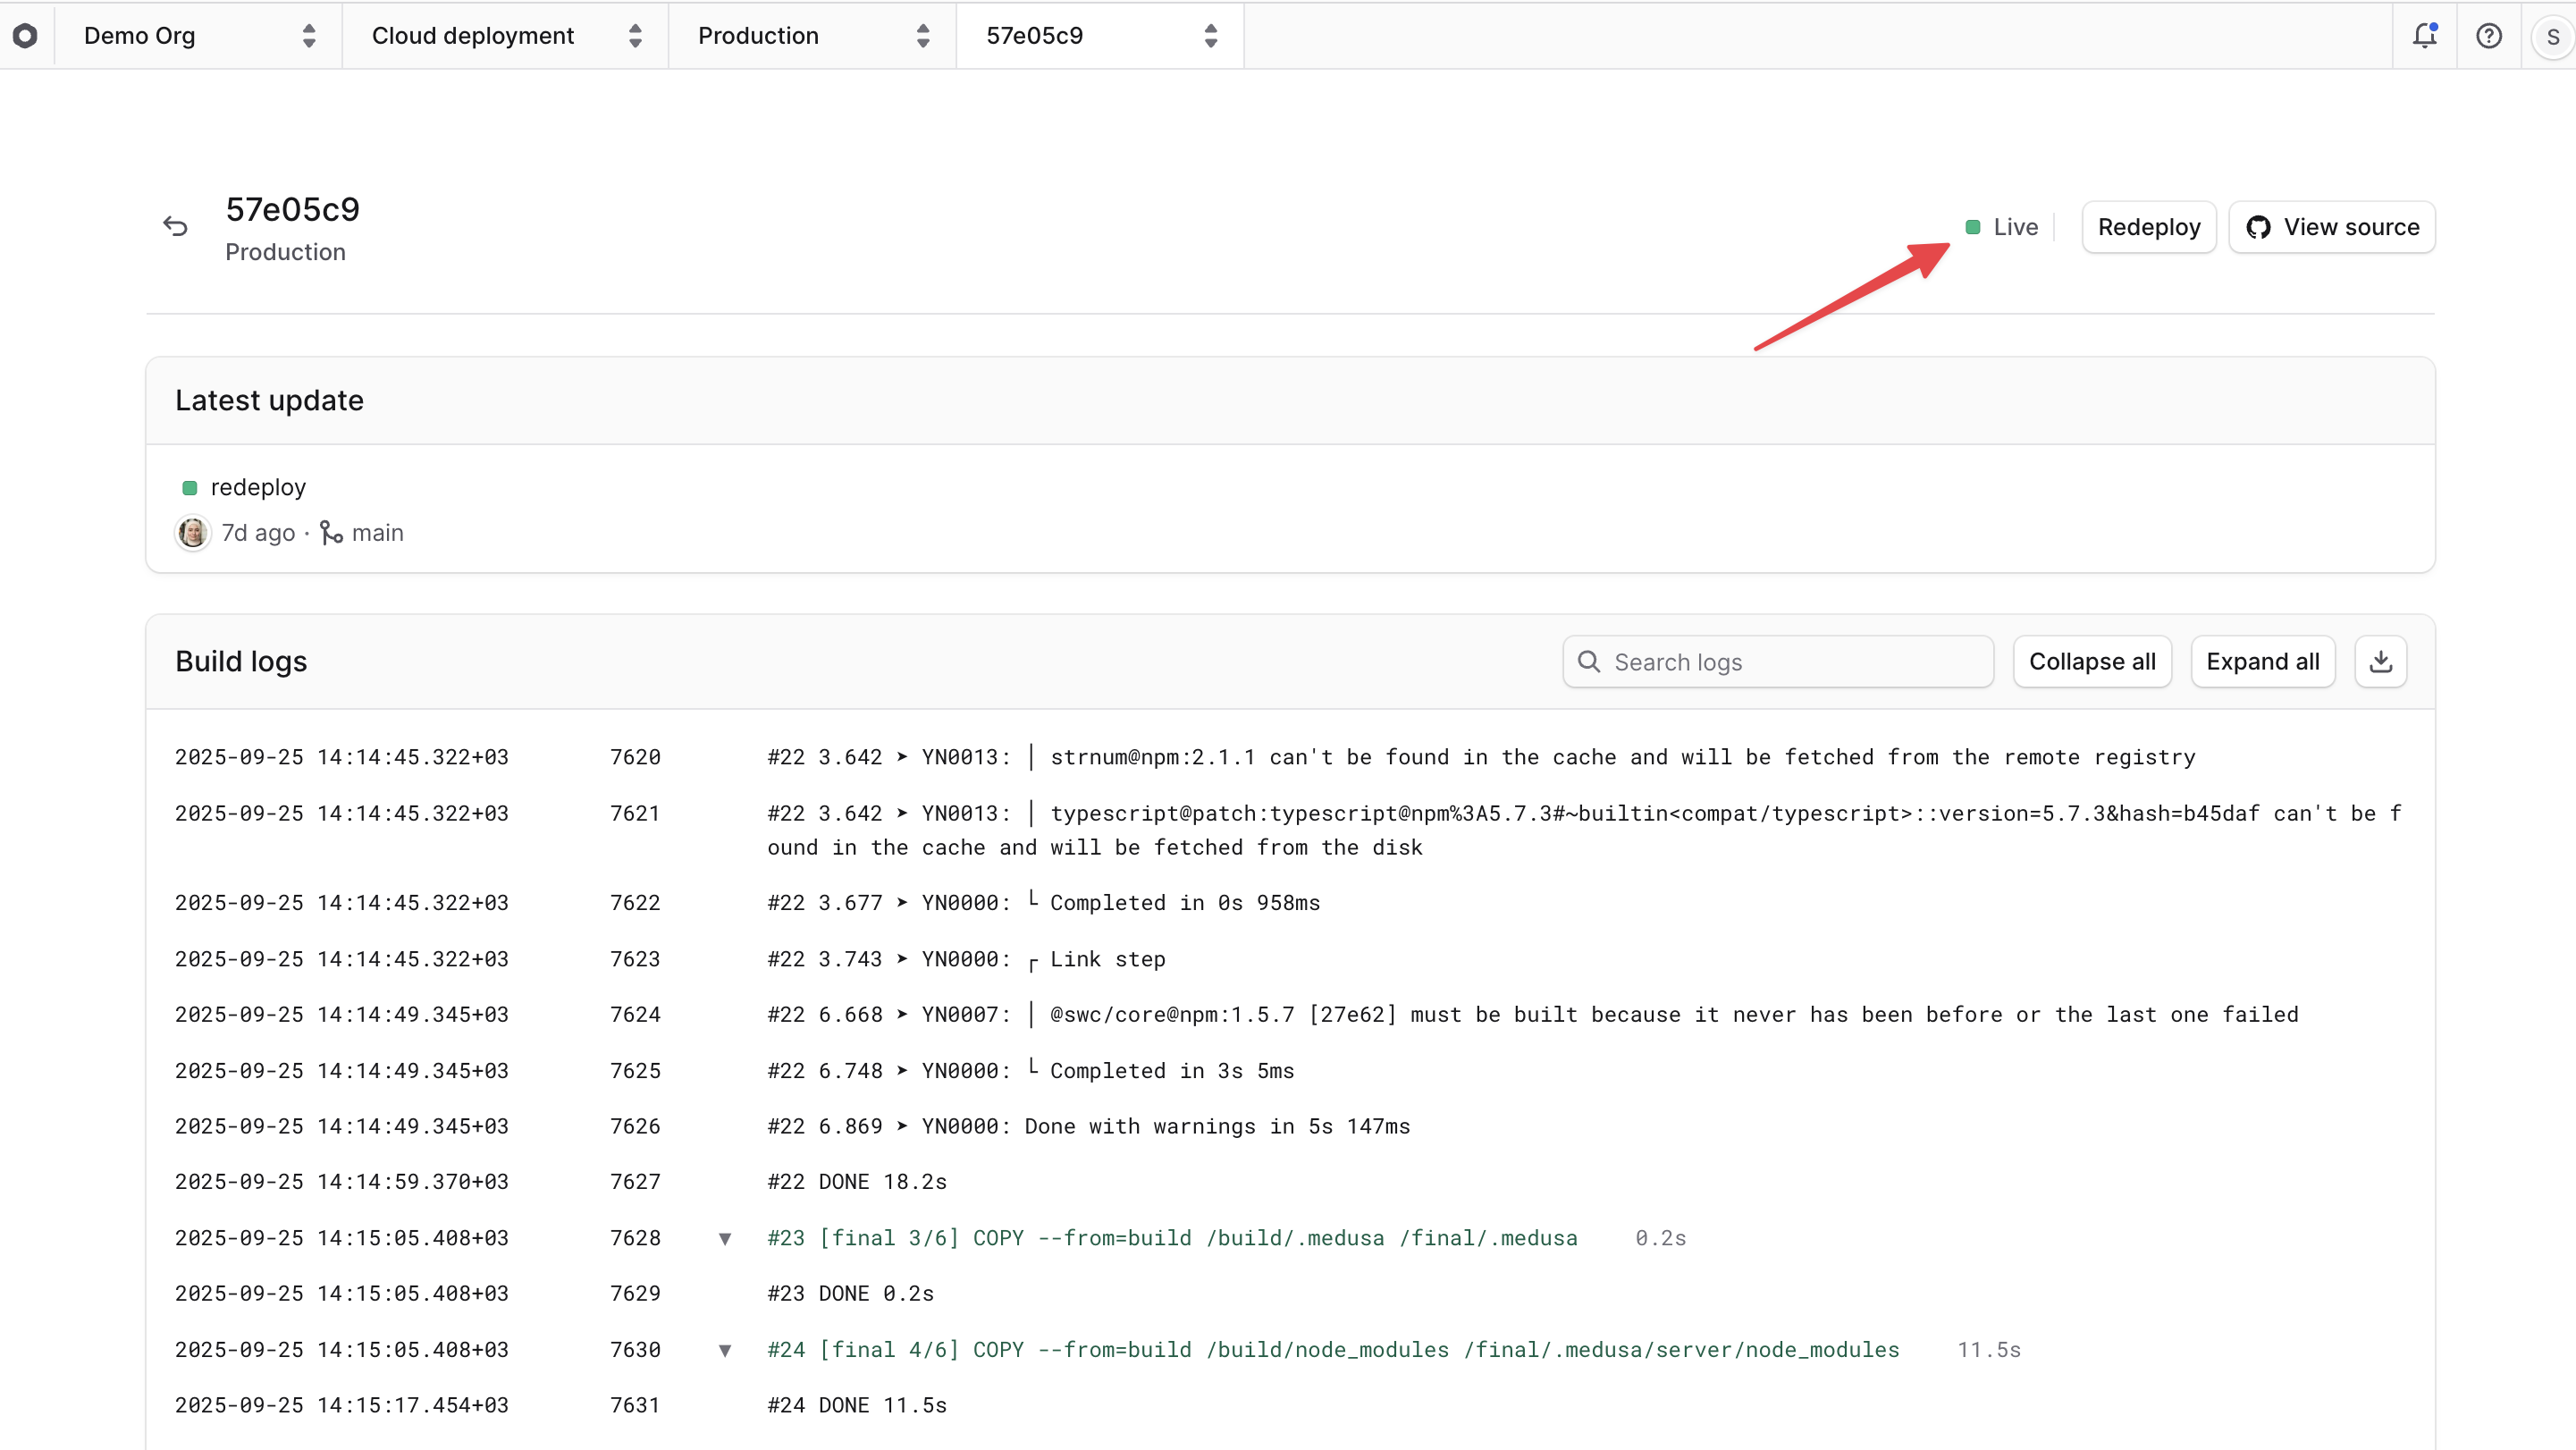
This will open the deployment's details page, where you can also see the deployment's commit at the top of the page.
|
|
|
|
On the deployment details page, you'll find:
|
|
|
|
|
|
|
|
1. **Commit**: The commit that the deployment was created from. This is the page's title.
|
|
2. **Status**: The current [status](#deployment-statuses-and-lifecycle) of the deployment. For example, "Live" or "Build Failed". You can see it next to the "Redeploy" button.
|
|
3. **Author**: The GitHub user who pushed the commit that created the deployment. You can see the user name when you hover over the user's avatar.
|
|
4. **Build Logs**: This section shows the logs from the build process. They are useful to understand why a deployment failed. Learn more in the [Logs](../logs/page.mdx) guide.
|
|
|
|
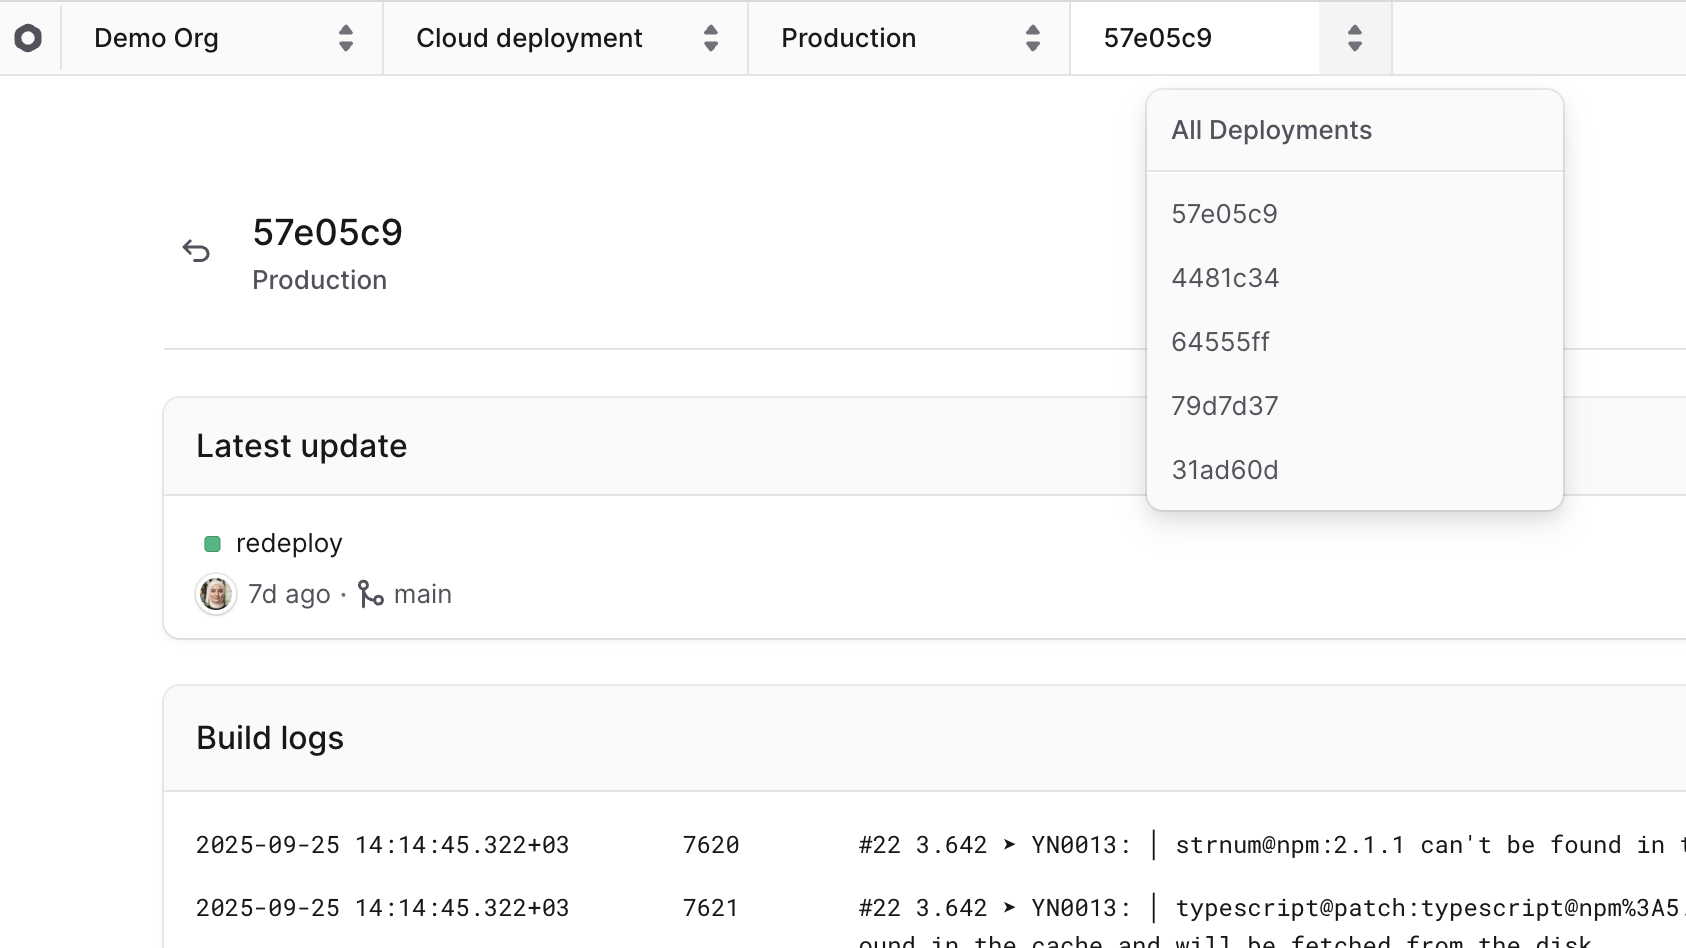
### Switch Between Deployments
|
|
|
|
The deployment's commit at the top of the Cloud dashboard is also a deployment switcher.
|
|
|
|
To switch to a different deployment:
|
|
|
|
1. Click on the deployment's commit at the top of the Cloud dashboard, next to the environment's name.
|
|
2. Choose the deployment you want to switch to from the dropdown.
|
|
|
|
|
|
|
|
This will change the view to the selected deployment and you'll see its details and logs.
|
|
|
|
---
|
|
|
|
## Access Live Deployment
|
|
|
|
You can only access a deployment once its status is "Live". You can access it through its environment's URL.
|
|
|
|
### Find Environment's URL
|
|
|
|
<Note>
|
|
|
|
For preview environments, refer to the [Preview Environments](../environments/preview/page.mdx#access-deployed-preview-environment) guide to find the URL of the preview environment.
|
|
|
|
</Note>
|
|
|
|
An environment's URL is in the format `<subdomain>.medusajs.app`, where `<subdomain>` is the subdomain you set either when [creating its project](../projects/page.mdx#create-a-project) or when [creating the environment](../environments/long-lived/page.mdx#create-a-long-lived-environment).
|
|
|
|
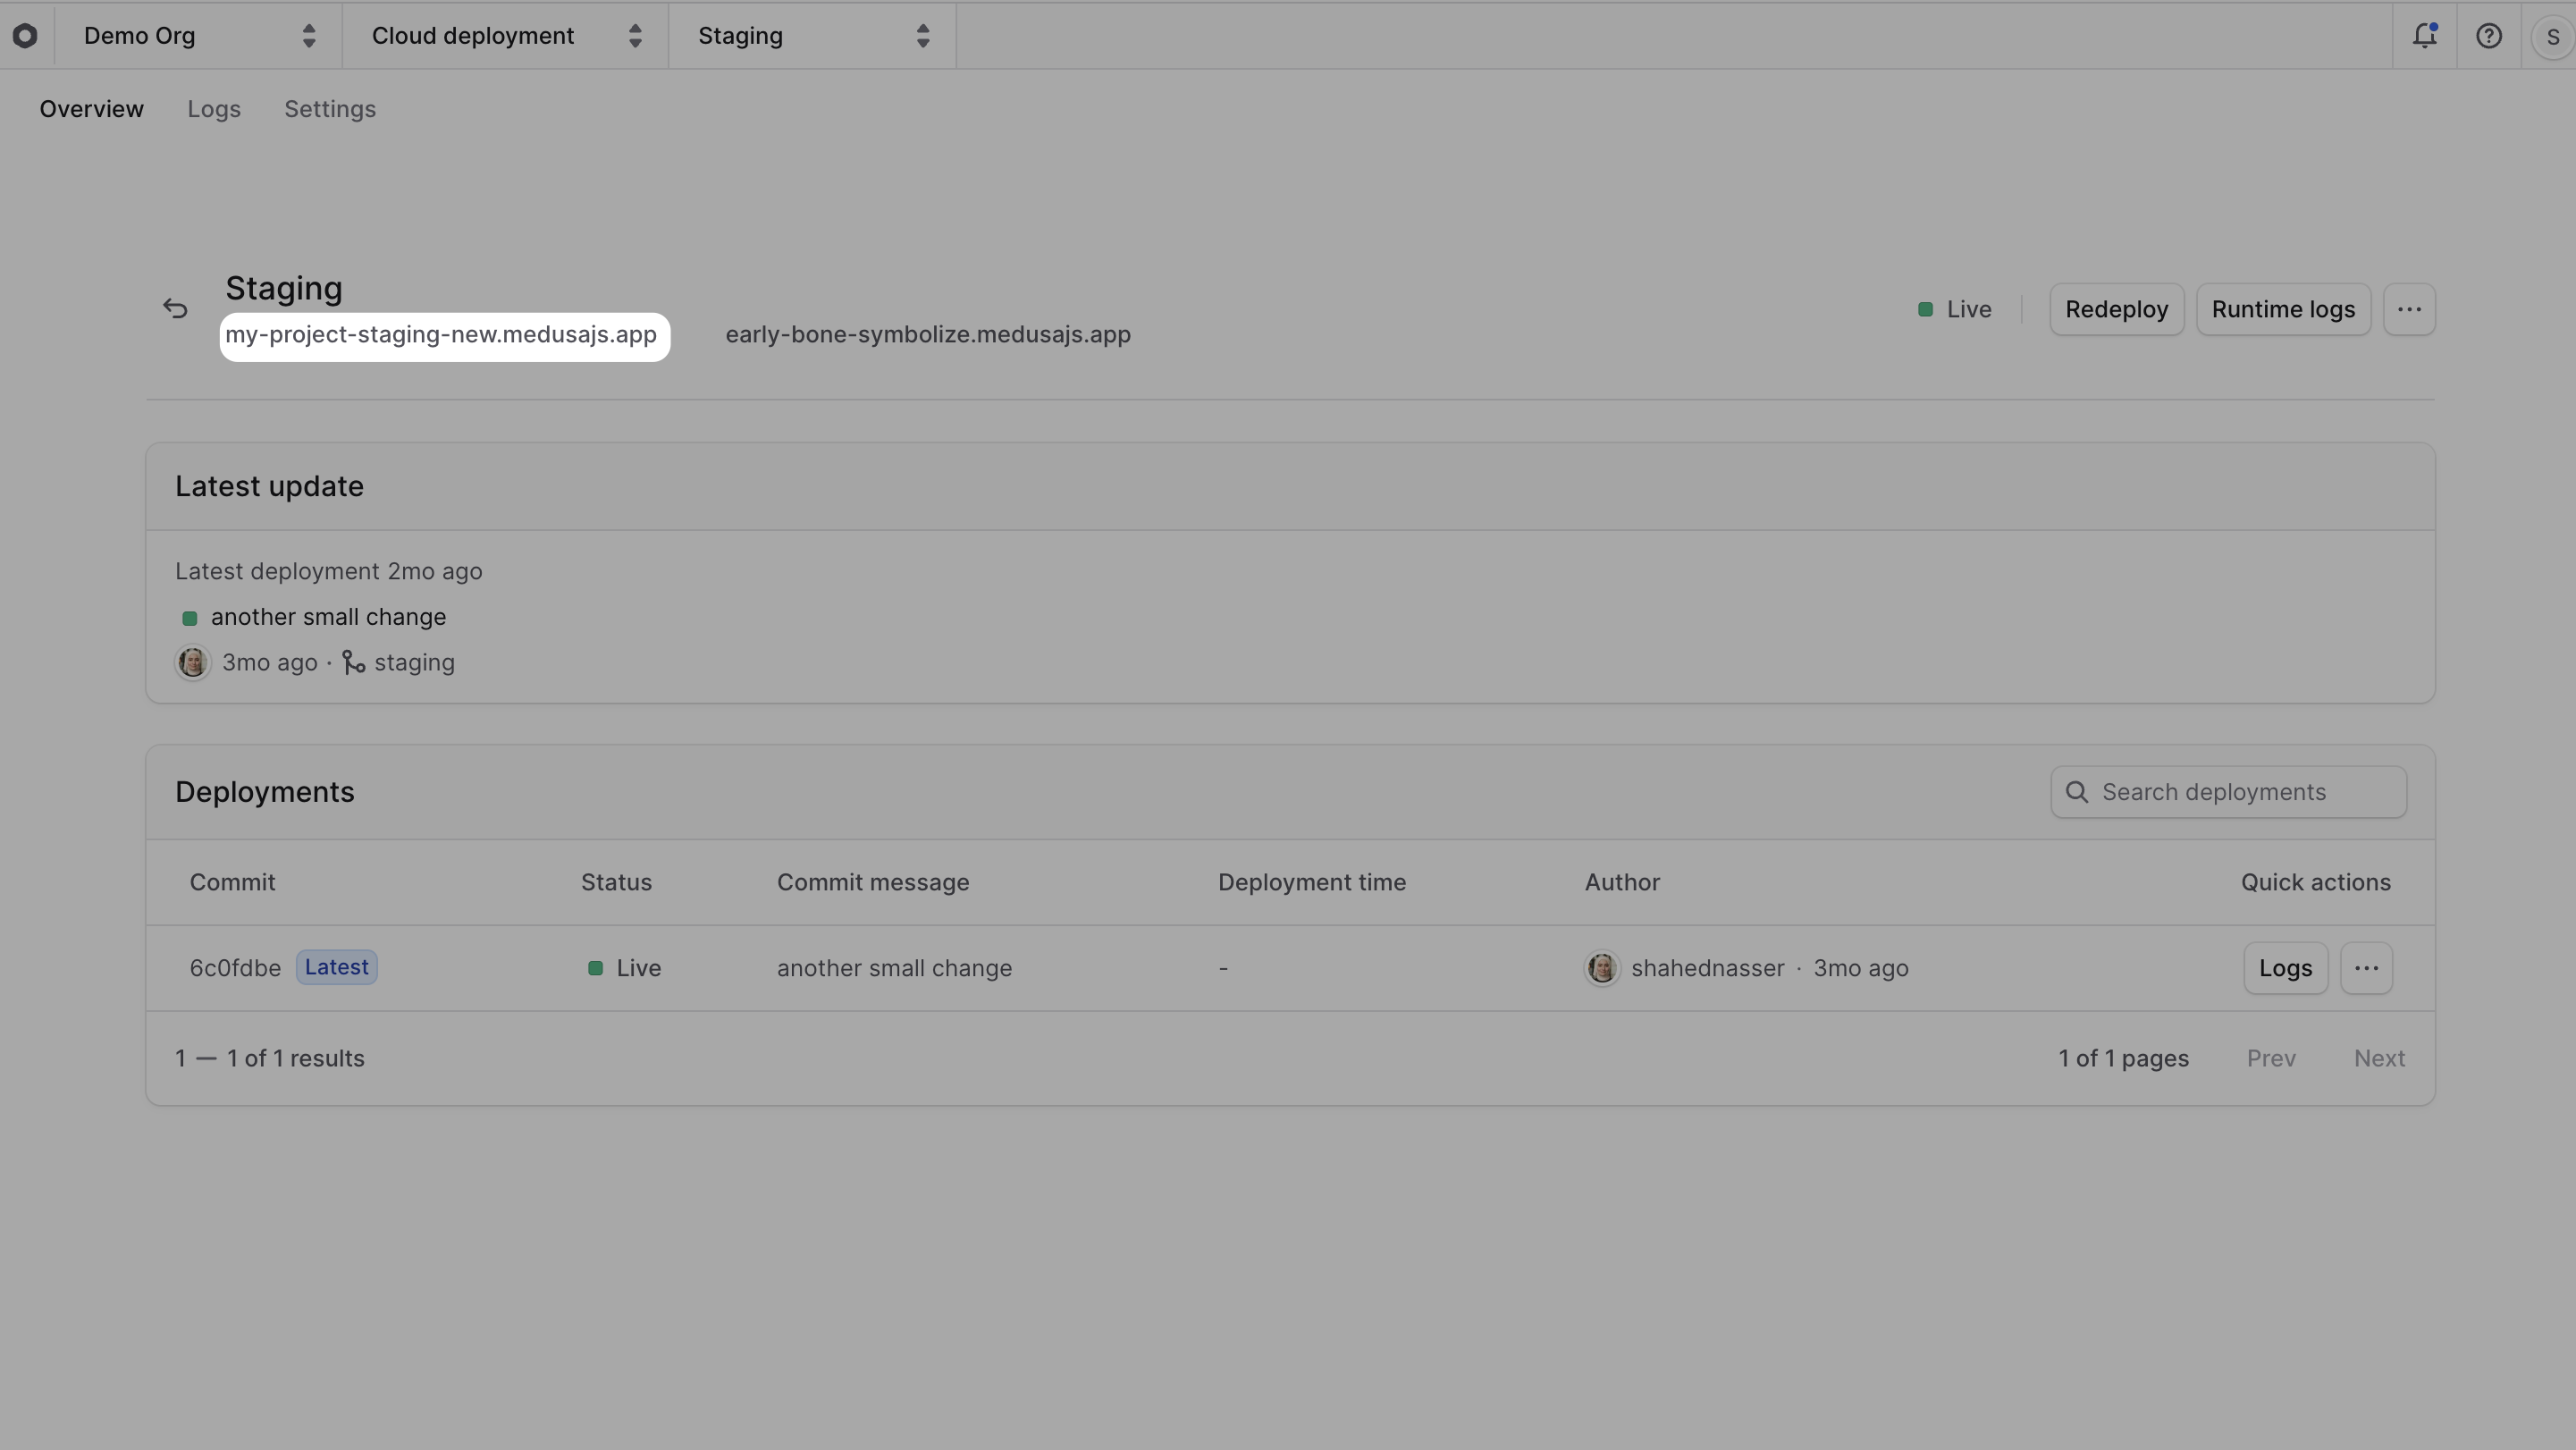
You can also find the URL of a deployment's environment through the Cloud dashboard:
|
|
|
|
1. Select a project from the [organization's dashboard](../organizations/page.mdx#organization-dashboard).
|
|
2. In the project's dashboard, find the URL in the environment's card under its name. For example, find the production URL in the Production environment card.
|
|
|
|
<Note title="Why are there two URLs?">
|
|
|
|
Aside from the subdomain you set when [creating the environment](../environments/long-lived/page.mdx#create-a-long-lived-environment), Medusa also provides a unique, randomly generated URL for each environment. Both of these URLs point to the same deployment.
|
|
|
|
</Note>
|
|
|
|
|
|
|
|
3. You can also click on the environment's name to open its dashboard, where you'll find the URL under the environment's name.
|
|
|
|
|
|
|
|
### Access the Deployment's Medusa Admin
|
|
|
|
To access the Medusa Admin of a live deployment, click on [the environment's URL](#find-environments-url).
|
|
|
|
You can then log in using the email and password set either [during project creation](../projects/page.mdx#create-a-project) or [in the environment's variables](../environments/long-lived/page.mdx#create-medusa-admin-user-in-environment).
|
|
|
|
### Send Requests to the Deployment
|
|
|
|
You can send requests to a live deployment's API routes using its URL.
|
|
|
|
For example, to check the health of the live deployment, you can send a `GET` request to the `/health` endpoint:
|
|
|
|
```bash
|
|
curl https://my-project.medusajs.app/health
|
|
```
|
|
|
|
Where `my-project` is the subdomain you set either when [creating the project](../projects/page.mdx#create-a-project) or when [creating the environment](../environments/long-lived/page.mdx#create-a-long-lived-environment).
|
|
|
|
### Access Deployment's Server through SSH
|
|
|
|
Medusa doesn't support SSH access to the server instance of a deployment. However, you can still access the server's [runtime and build logs](../logs/page.mdx) to debug issues in your application.
|
|
|
|
If this isn't sufficient for your use case, you can contact support to discuss alternatives.
|
|
|
|
---
|
|
|
|
## Deployment Statuses and Lifecycle
|
|
|
|
A deployment can have one of the following statuses:
|
|
|
|
<Table>
|
|
<Table.Header>
|
|
<Table.Row>
|
|
<Table.HeaderCell>
|
|
Status
|
|
</Table.HeaderCell>
|
|
<Table.HeaderCell>
|
|
Description
|
|
</Table.HeaderCell>
|
|
</Table.Row>
|
|
</Table.Header>
|
|
<Table.Body>
|
|
<Table.Row>
|
|
<Table.Cell>
|
|
Building
|
|
</Table.Cell>
|
|
<Table.Cell>
|
|
The deployment is currently being built. This is the initial status of a deployment.
|
|
</Table.Cell>
|
|
</Table.Row>
|
|
<Table.Row>
|
|
<Table.Cell>
|
|
Build canceled
|
|
</Table.Cell>
|
|
<Table.Cell>
|
|
The build process was canceled due to a newer commit pushed to the branch, which resulted in a new deployment.
|
|
</Table.Cell>
|
|
</Table.Row>
|
|
<Table.Row>
|
|
<Table.Cell>
|
|
Build failed
|
|
</Table.Cell>
|
|
<Table.Cell>
|
|
The build process failed due to a build error. You can check the [build logs](../logs/page.mdx) to troubleshoot the issue.
|
|
</Table.Cell>
|
|
</Table.Row>
|
|
<Table.Row>
|
|
<Table.Cell>
|
|
Awaiting deployment
|
|
</Table.Cell>
|
|
<Table.Cell>
|
|
The deployment has finished building and is waiting to be deployed.
|
|
</Table.Cell>
|
|
</Table.Row>
|
|
<Table.Row>
|
|
<Table.Cell>
|
|
Deploying
|
|
</Table.Cell>
|
|
<Table.Cell>
|
|
The deployment is currently being deployed.
|
|
</Table.Cell>
|
|
</Table.Row>
|
|
<Table.Row>
|
|
<Table.Cell>
|
|
Deploy failed
|
|
</Table.Cell>
|
|
<Table.Cell>
|
|
The deployment failed during the deployment process. You can check the [Runtime Logs](../logs/page.mdx) to troubleshoot the issue.
|
|
</Table.Cell>
|
|
</Table.Row>
|
|
<Table.Row>
|
|
<Table.Cell>
|
|
Live
|
|
</Table.Cell>
|
|
<Table.Cell>
|
|
The deployment finished successfully and is now the live version of the environment.
|
|
</Table.Cell>
|
|
</Table.Row>
|
|
<Table.Row>
|
|
<Table.Cell>
|
|
Ready
|
|
</Table.Cell>
|
|
<Table.Cell>
|
|
The deployment was previously deployed, but it's not currently the live version of the environment. This happens when a new deployment becomes the live version.
|
|
</Table.Cell>
|
|
</Table.Row>
|
|
</Table.Body>
|
|
</Table>
|
|
|
|
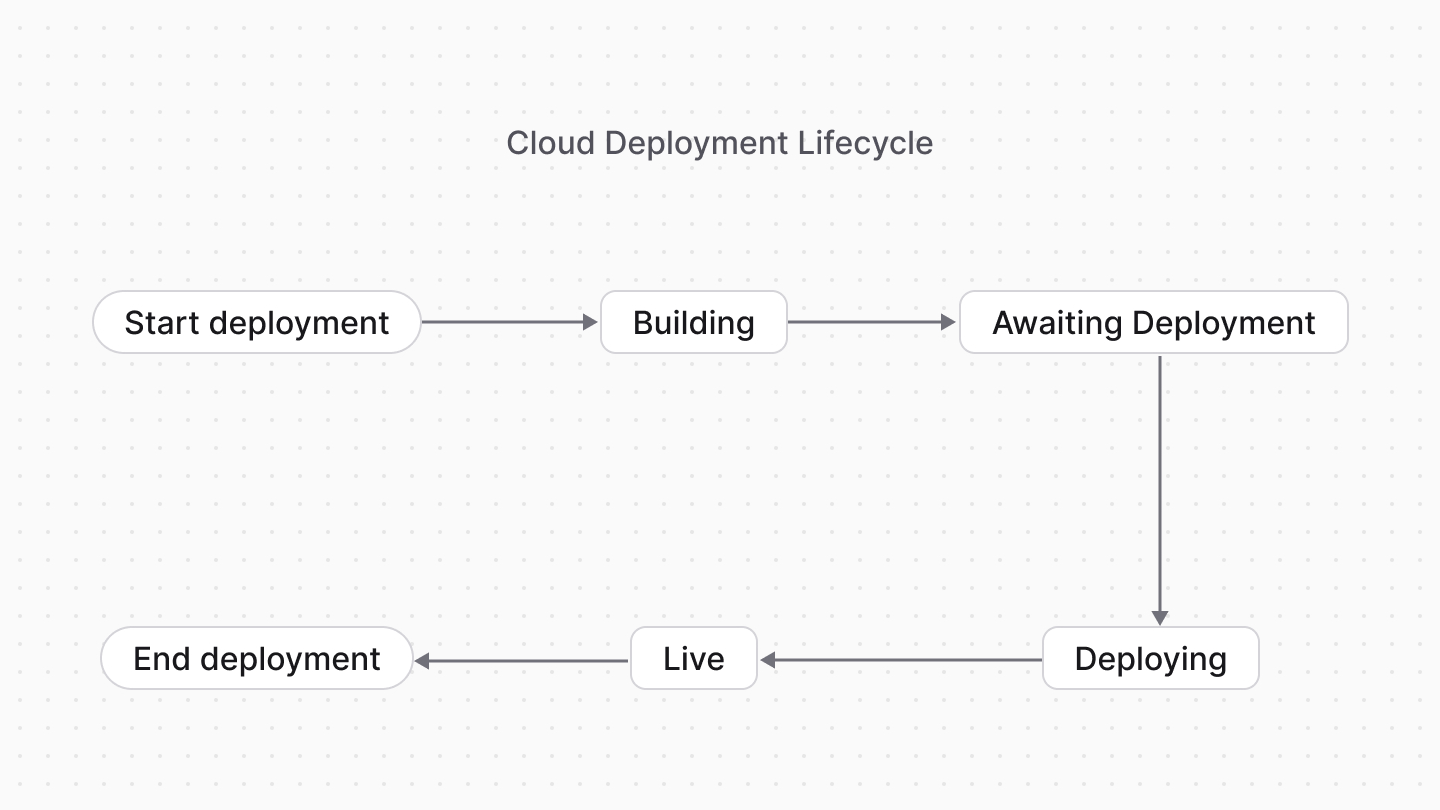
So, the lifecycle of a successful deployment is Building → Awaiting deployment → Deploying → Live. Then, once a new deployment is created, the previous deployment's status changes to Ready.
|
|
|
|
<Note>
|
|
|
|
If a deployment is stuck at a status like "Building" or "Deploying" for a long time, contact support for assistance.
|
|
|
|
</Note>
|
|
|
|
|
|
|
|
---
|
|
|
|
## Troubleshooting Failed Deployments
|
|
|
|
### Troubleshooting Build Failures
|
|
|
|
If a deployment's status is "Build failed", you can check the [build logs](../logs/page.mdx) to understand why it failed. The build logs will show you the errors that occurred during the build process, which can help you fix the issue in your code.
|
|
|
|
You can also contact support for help with the issue, if necessary.
|
|
|
|
### Troubleshooting Deployment Failures
|
|
|
|
If a deployment's status is "Deploy failed", you can check the [runtime logs](../logs/page.mdx) to understand why it failed. The runtime logs will show you the errors that occurred during the deployment process, which can help you fix the issue in your code.
|
|
|
|
You can also contact support for help with the issue, if necessary.
|
|
|
|
---
|
|
|
|
## Redeploy a Deployment
|
|
|
|
You might need to redeploy an old deployment if there are unexpected issues with the current live deployment.
|
|
|
|
By redeploying a previous deployment, you revert or rollback the live version of its environment to the code in that deployment's commit.
|
|
|
|
<Note title="Important">
|
|
|
|
Redeploying a deployment will not revert database changes made in the latest deployment. If you need to revert database changes, contact support for assistance based on your use case.
|
|
|
|
</Note>
|
|
|
|
To redeploy a deployment:
|
|
|
|
1. [Go to the deployment's details page](#find-deployment-details).
|
|
2. Click the "Redeploy" button at the top right of the page.
|
|
|
|
|
|
|
|
This will trigger the redeployment process for the selected deployment. The deployment will go through [the same lifecycle](#deployment-statuses-and-lifecycle) as a new deployment.
|
|
|
|
Once the redeployment is complete, the deployment's status will change to "Live" and it will become the new live version of the environment.
|
|
|
|
---
|
|
|
|
## Change Deployment Rules
|
|
|
|
For each environment, you can change the rules that trigger a new deployment. For example, you can change the branch that the environment is connected to, which changes when a new deployment is created.
|
|
|
|
<Note>
|
|
|
|
Changing the branch associated with an environment only works for [long-lived environments](../environments/long-lived/page.mdx).
|
|
|
|
</Note>
|
|
|
|
To change the deployment rules for an environment:
|
|
|
|
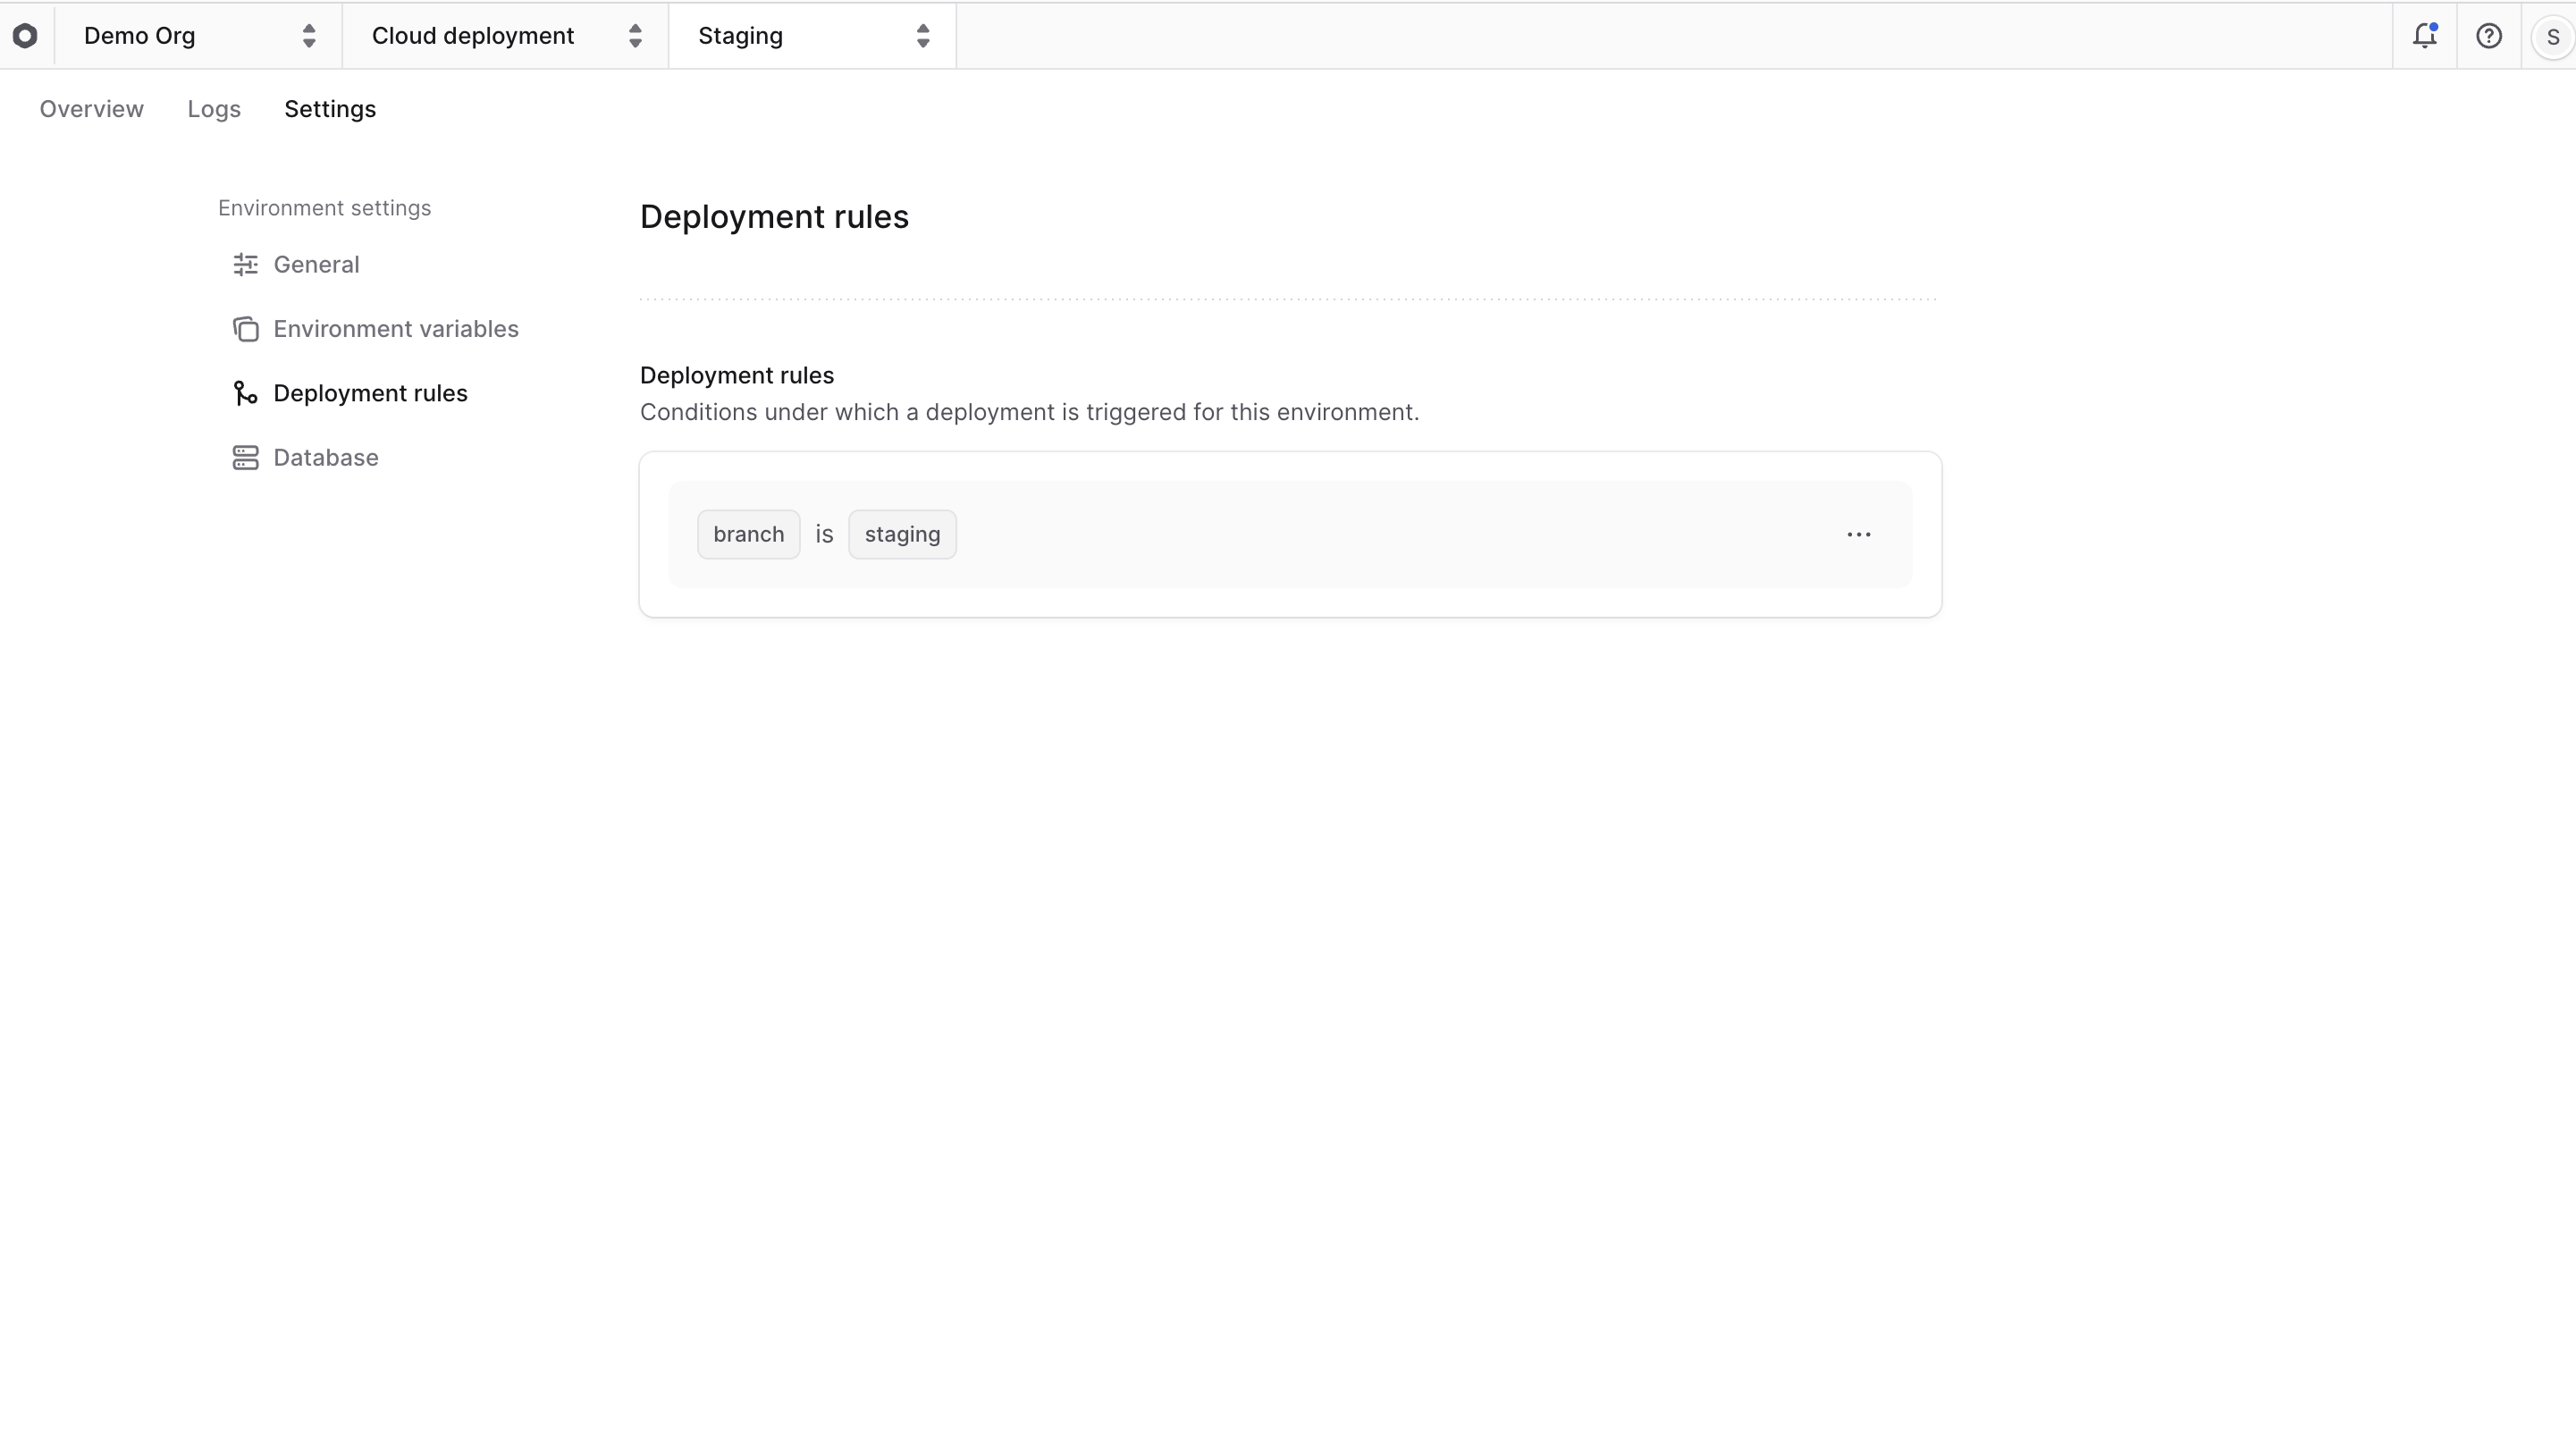
1. [Go to the environment's dashboard](#find-environment-deployments).
|
|
2. Click on the "Settings" tab.
|
|
3. Click on the "Deployment rules" tab in the sidebar.
|
|
4. You'll find a `branch` rule. You can edit it by clicking the <InlineIcon Icon={EllipsisHorizontal} alt="three-dots" /> icon and choosing "Edit" from the dropdown.
|
|
|
|
|
|
|
|
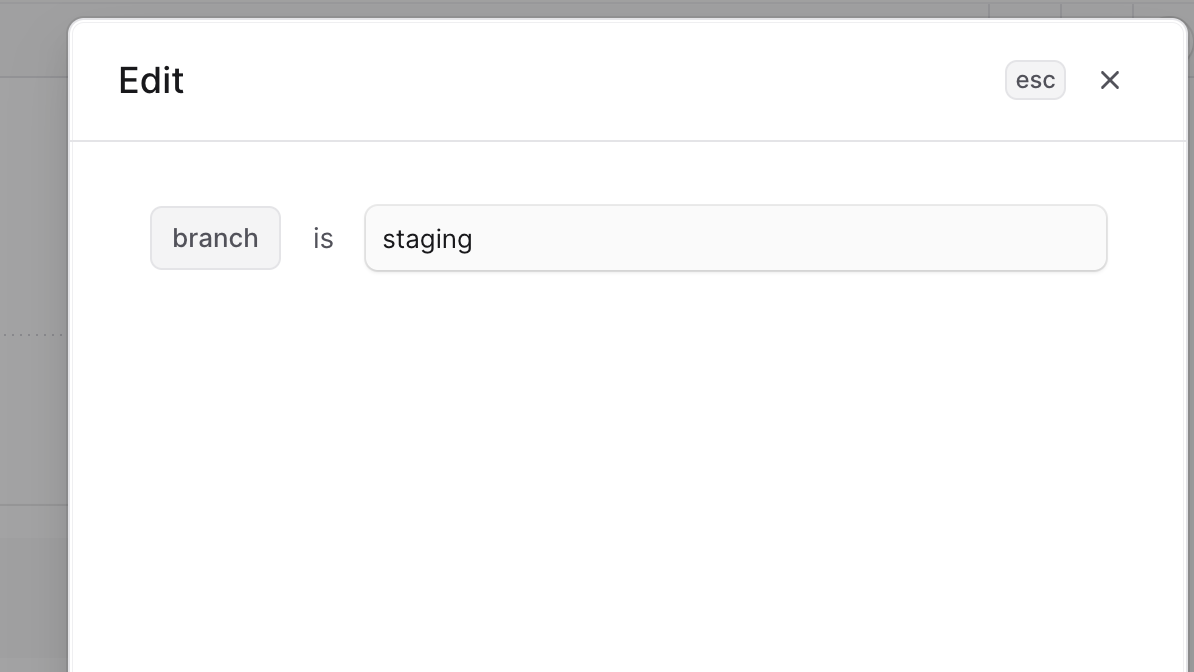
5. In the side window that opens, you can change the branch that the environment is connected to. For example, you can change it from `main` to `staging` to create a new deployment every time you push a commit to the `staging` branch.
|
|
6. Click "Save" to apply the changes.
|
|
|
|
The deployment rules will take effect for next deployments. For example, if you change the branch to `staging`, the next deployment will be created from the latest commit in the `staging` branch.
|
|
|
|
|